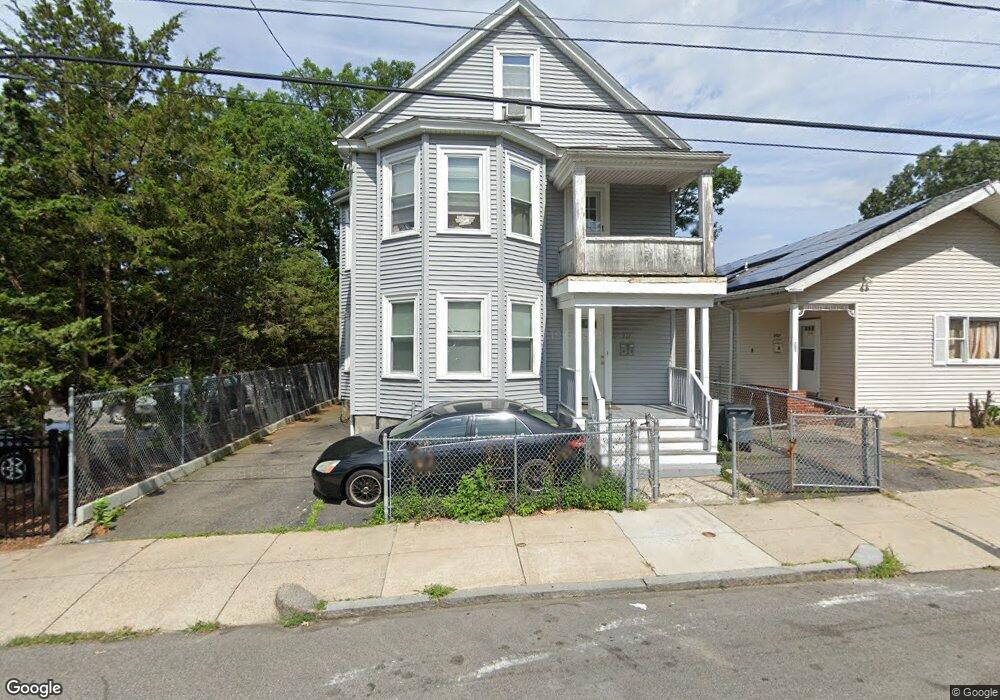
211 Delhi St Mattapan, MA 02126
Southern Mattapan NeighborhoodEstimated Value: $690,992 - $712,000
6
Beds
2
Baths
2,860
Sq Ft
$246/Sq Ft
Est. Value
About This Home
This home is located at 211 Delhi St, Mattapan, MA 02126 and is currently estimated at $703,998, approximately $246 per square foot. 211 Delhi St is a home located in Suffolk County with nearby schools including KIPP Academy Boston Charter School and Berea Seventh-day Adventist Academy.
Ownership History
Date
Name
Owned For
Owner Type
Purchase Details
Closed on
Jun 13, 2025
Sold by
Dyer Emmeline M
Bought by
Dyer Jameel
Current Estimated Value
Home Financials for this Owner
Home Financials are based on the most recent Mortgage that was taken out on this home.
Original Mortgage
$564,712
Outstanding Balance
$562,258
Interest Rate
6.76%
Mortgage Type
FHA
Estimated Equity
$141,740
Purchase Details
Closed on
Nov 22, 1995
Sold by
Bastien Rock F and Dyer Emmeline M
Bought by
Bastien Emmeline M
Home Financials for this Owner
Home Financials are based on the most recent Mortgage that was taken out on this home.
Original Mortgage
$60,000
Interest Rate
7.47%
Mortgage Type
Purchase Money Mortgage
Create a Home Valuation Report for This Property
The Home Valuation Report is an in-depth analysis detailing your home's value as well as a comparison with similar homes in the area
Home Values in the Area
Average Home Value in this Area
Purchase History
| Date | Buyer | Sale Price | Title Company |
|---|---|---|---|
| Dyer Jameel | $700,000 | None Available | |
| Dyer Jameel | $700,000 | None Available | |
| Bastien Emmeline M | $90,000 | -- | |
| Bastien Emmeline M | $90,000 | -- |
Source: Public Records
Mortgage History
| Date | Status | Borrower | Loan Amount |
|---|---|---|---|
| Open | Dyer Jameel | $564,712 | |
| Closed | Dyer Jameel | $564,712 | |
| Previous Owner | Bastien Emmeline M | $100,000 | |
| Previous Owner | Bastien Emmeline M | $60,000 |
Source: Public Records
Tax History Compared to Growth
Tax History
| Year | Tax Paid | Tax Assessment Tax Assessment Total Assessment is a certain percentage of the fair market value that is determined by local assessors to be the total taxable value of land and additions on the property. | Land | Improvement |
|---|---|---|---|---|
| 2025 | $7,269 | $627,700 | $187,700 | $440,000 |
| 2024 | $6,523 | $598,400 | $161,300 | $437,100 |
| 2023 | $6,008 | $559,400 | $150,800 | $408,600 |
| 2022 | $5,740 | $527,600 | $142,200 | $385,400 |
| 2021 | $5,212 | $488,500 | $131,700 | $356,800 |
| 2020 | $4,678 | $443,000 | $123,200 | $319,800 |
| 2019 | $4,132 | $392,000 | $88,500 | $303,500 |
| 2018 | $3,735 | $356,400 | $88,500 | $267,900 |
| 2017 | $4,171 | $393,900 | $88,500 | $305,400 |
| 2016 | $3,869 | $351,700 | $88,500 | $263,200 |
| 2015 | $3,803 | $314,000 | $96,200 | $217,800 |
| 2014 | $3,409 | $271,000 | $96,200 | $174,800 |
Source: Public Records
Map
Nearby Homes
- 11 French St
- 157 Delhi St
- 32 Violet St
- 4 Crossman St Unit 4
- 567B Norfolk St
- 1465 Blue Hill Ave
- 12 Hiawatha Rd
- 25 Fessenden St
- 710 Walk Hill St
- 23 Fessenden St
- 45 1st Ave Unit 111
- 24 Constitution Rd
- 58 Mattapan St
- 10 Briarcliff Terrace
- 49 Fottler Rd
- 116 Almont St
- 10 Itasca St
- 18 Astoria St
- 20 Monterey Ave
- 60 and 64 Monterey Ave