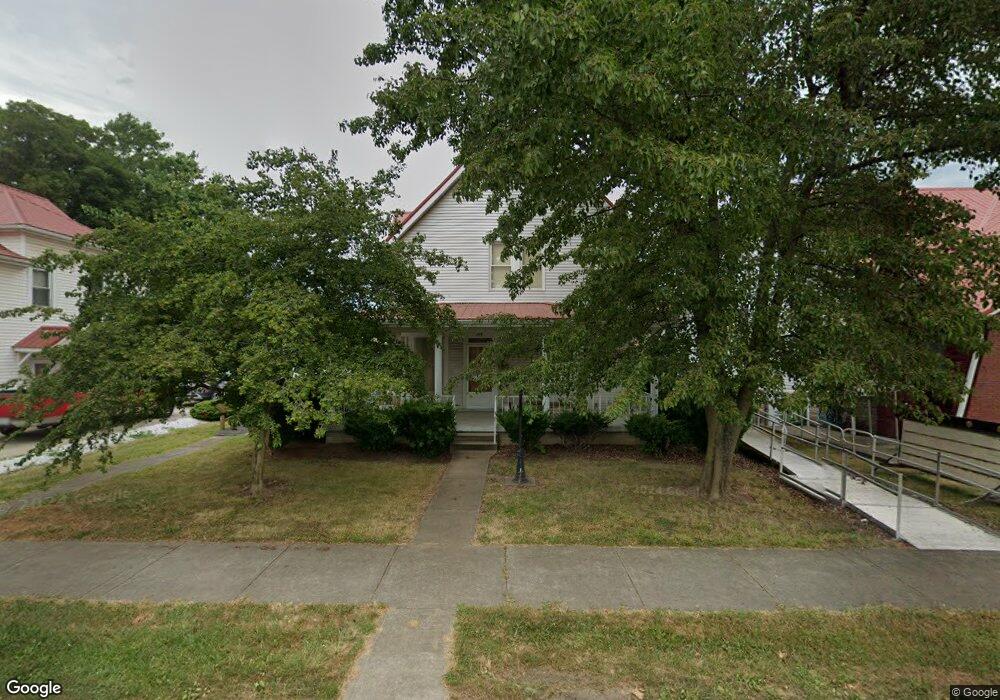
211 E 2nd St Waverly, OH 45690
Estimated Value: $193,000 - $231,000
Studio
2
Baths
2,052
Sq Ft
$101/Sq Ft
Est. Value
About This Home
This home is located at 211 E 2nd St, Waverly, OH 45690 and is currently estimated at $206,855, approximately $100 per square foot. 211 E 2nd St is a home located in Pike County with nearby schools including Waverly Primary School, Waverly Intermediate School, and Waverly Junior High School.
Ownership History
Date
Name
Owned For
Owner Type
Purchase Details
Closed on
Mar 28, 2025
Sold by
Anchor Of Hope Church Of God Inc
Bought by
Gibbs Steveonne S
Current Estimated Value
Home Financials for this Owner
Home Financials are based on the most recent Mortgage that was taken out on this home.
Original Mortgage
$191,468
Outstanding Balance
$190,650
Interest Rate
6.85%
Mortgage Type
FHA
Estimated Equity
$16,205
Create a Home Valuation Report for This Property
The Home Valuation Report is an in-depth analysis detailing your home's value as well as a comparison with similar homes in the area
Home Values in the Area
Average Home Value in this Area
Purchase History
| Date | Buyer | Sale Price | Title Company |
|---|---|---|---|
| Gibbs Steveonne S | $195,000 | None Listed On Document | |
| Gibbs Steveonne S | $195,000 | None Listed On Document |
Source: Public Records
Mortgage History
| Date | Status | Borrower | Loan Amount |
|---|---|---|---|
| Open | Gibbs Steveonne S | $191,468 | |
| Closed | Gibbs Steveonne S | $191,468 |
Source: Public Records
Tax History
| Year | Tax Paid | Tax Assessment Tax Assessment Total Assessment is a certain percentage of the fair market value that is determined by local assessors to be the total taxable value of land and additions on the property. | Land | Improvement |
|---|---|---|---|---|
| 2024 | $1,865 | $49,470 | $9,550 | $39,920 |
| 2023 | $1,795 | $49,470 | $9,550 | $39,920 |
| 2022 | $1,819 | $43,530 | $6,990 | $36,540 |
| 2021 | $1,786 | $43,530 | $6,990 | $36,540 |
| 2020 | $1,787 | $43,530 | $6,990 | $36,540 |
| 2019 | $1,529 | $36,890 | $5,930 | $30,960 |
| 2018 | $1,508 | $36,890 | $5,930 | $30,960 |
| 2017 | $1,422 | $36,890 | $5,930 | $30,960 |
| 2016 | $1,337 | $31,530 | $5,690 | $25,840 |
| 2015 | $1,337 | $31,530 | $5,690 | $25,840 |
| 2014 | $1,295 | $31,530 | $5,690 | $25,840 |
| 2013 | $1,312 | $31,530 | $5,690 | $25,840 |
| 2012 | $1,343 | $31,530 | $5,690 | $25,840 |
Source: Public Records
Map
Nearby Homes
Your Personal Tour Guide
Ask me questions while you tour the home.