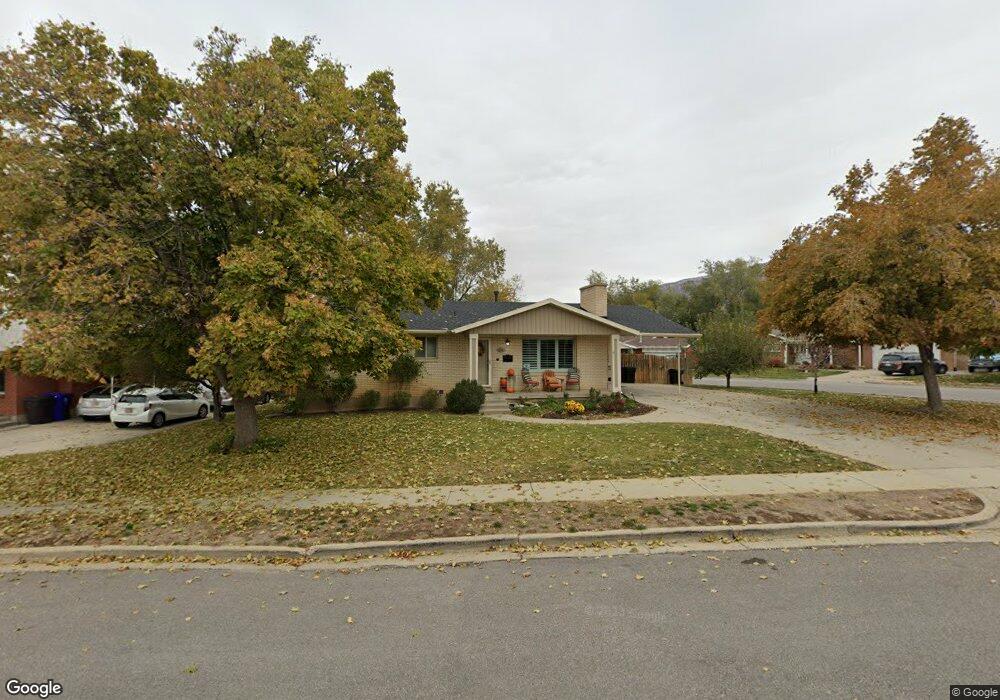
211 E 750 N Bountiful, UT 84010
Estimated Value: $510,000 - $538,000
4
Beds
2
Baths
1,148
Sq Ft
$456/Sq Ft
Est. Value
About This Home
This home is located at 211 E 750 N, Bountiful, UT 84010 and is currently estimated at $523,219, approximately $455 per square foot. 211 E 750 N is a home located in Davis County with nearby schools including Tolman School, Bountiful Junior High School, and Viewmont High School.
Ownership History
Date
Name
Owned For
Owner Type
Purchase Details
Closed on
Jun 16, 2023
Sold by
Davis Sidney Curtis and Davis Karen Ivie
Bought by
Sidney And Karen Davis Family Trust and Davis
Current Estimated Value
Purchase Details
Closed on
Sep 24, 2012
Sold by
Davis Sidney C and Davis Karen I
Bought by
Davis Sidney Curtis and Davis Karen Ivie
Home Financials for this Owner
Home Financials are based on the most recent Mortgage that was taken out on this home.
Original Mortgage
$98,800
Interest Rate
3.59%
Mortgage Type
New Conventional
Purchase Details
Closed on
Nov 13, 1997
Sold by
Christensen Andrew D and Christensen Doti
Bought by
Davis Sidney C and Davis Karen I
Home Financials for this Owner
Home Financials are based on the most recent Mortgage that was taken out on this home.
Original Mortgage
$105,000
Interest Rate
7.3%
Create a Home Valuation Report for This Property
The Home Valuation Report is an in-depth analysis detailing your home's value as well as a comparison with similar homes in the area
Purchase History
| Date | Buyer | Sale Price | Title Company |
|---|---|---|---|
| Sidney And Karen Davis Family Trust | -- | None Listed On Document | |
| Davis Sidney Curtis | -- | Backman Title Servic | |
| Davis Sidney C | -- | Associated Title Company |
Source: Public Records
Mortgage History
| Date | Status | Borrower | Loan Amount |
|---|---|---|---|
| Previous Owner | Davis Sidney Curtis | $98,800 | |
| Previous Owner | Davis Sidney C | $105,000 |
Source: Public Records
Tax History
| Year | Tax Paid | Tax Assessment Tax Assessment Total Assessment is a certain percentage of the fair market value that is determined by local assessors to be the total taxable value of land and additions on the property. | Land | Improvement |
|---|---|---|---|---|
| 2025 | $2,908 | $262,900 | $125,959 | $136,941 |
| 2024 | $2,724 | $255,750 | $112,627 | $143,123 |
| 2023 | $2,602 | $443,000 | $207,170 | $235,830 |
| 2022 | $2,605 | $243,100 | $113,115 | $129,985 |
| 2021 | $2,277 | $324,000 | $148,039 | $175,961 |
| 2020 | $2,021 | $288,000 | $126,335 | $161,665 |
| 2019 | $2,052 | $286,000 | $132,585 | $153,415 |
| 2018 | $1,900 | $260,000 | $130,333 | $129,667 |
| 2016 | $1,763 | $131,450 | $54,553 | $76,897 |
| 2015 | $1,737 | $122,265 | $54,553 | $67,712 |
| 2014 | $1,637 | $118,242 | $54,553 | $63,689 |
| 2013 | -- | $101,290 | $41,748 | $59,542 |
Source: Public Records
Map
Nearby Homes
- 978 N 170 E
- 453 N 400 E Unit 7-D
- 513 N 400 E Unit 14B
- 17 E 400 N Unit 19B
- 214 E 1250 N
- 106 W 700 N
- 49 E 200 N Unit 4
- 41 E 200 N Unit 6
- 252 N Main St
- 256 N Main St
- 254 N Main St
- 55 E 200 N Unit 2
- 51 E 200 N Unit 3
- 1420 N Main St
- 1130 N 200 W
- 1260 N 200 W
- 499 N 200 W Unit 30
- 499 N 200 W Unit 19
- 563 N 200 W
- 320 N 200 W Unit 4
Your Personal Tour Guide
Ask me questions while you tour the home.