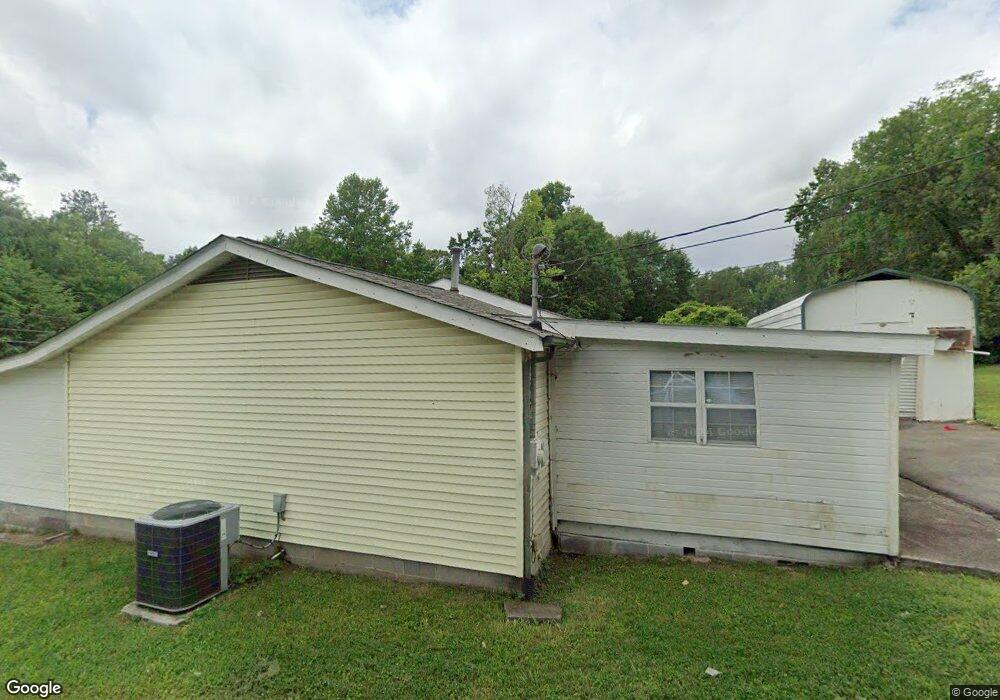
211 E Ezzard Ave Unit 3 Dalton, GA 30720
Estimated Value: $176,000 - $240,319
Studio
2
Baths
1,656
Sq Ft
$123/Sq Ft
Est. Value
About This Home
This home is located at 211 E Ezzard Ave Unit 3, Dalton, GA 30720 and is currently estimated at $204,330, approximately $123 per square foot. 211 E Ezzard Ave Unit 3 is a home located in Whitfield County with nearby schools including Dug Gap Elementary School, Valley Point Middle School, and Southeast Whitfield County High School.
Ownership History
Date
Name
Owned For
Owner Type
Purchase Details
Closed on
Jul 12, 2017
Sold by
Munguia Armando
Bought by
Robertson Hunter Shawn
Current Estimated Value
Home Financials for this Owner
Home Financials are based on the most recent Mortgage that was taken out on this home.
Original Mortgage
$93,279
Outstanding Balance
$77,523
Interest Rate
4.25%
Mortgage Type
FHA
Estimated Equity
$126,807
Purchase Details
Closed on
Jul 27, 2016
Bought by
Wells Fargo Bank
Purchase Details
Closed on
Jun 22, 2016
Bought by
Munguia Armando
Purchase Details
Closed on
Apr 7, 2015
Sold by
Wells Fargo Bank
Bought by
Sec Of Housing & Urban
Purchase Details
Closed on
Sep 8, 2004
Sold by
Bryant Charles E
Bought by
Bryant Charles E and Bryant Mary R
Create a Home Valuation Report for This Property
The Home Valuation Report is an in-depth analysis detailing your home's value as well as a comparison with similar homes in the area
Purchase History
| Date | Buyer | Sale Price | Title Company |
|---|---|---|---|
| Robertson Hunter Shawn | $95,000 | -- | |
| Wells Fargo Bank | -- | -- | |
| Munguia Armando | $63,000 | -- | |
| Sec Of Housing & Urban | $64,515 | -- | |
| Wells Fargo Bank | $64,515 | -- | |
| Bryant Charles E | -- | -- |
Source: Public Records
Mortgage History
| Date | Status | Borrower | Loan Amount |
|---|---|---|---|
| Open | Robertson Hunter Shawn | $93,279 |
Source: Public Records
Tax History
| Year | Tax Paid | Tax Assessment Tax Assessment Total Assessment is a certain percentage of the fair market value that is determined by local assessors to be the total taxable value of land and additions on the property. | Land | Improvement |
|---|---|---|---|---|
| 2025 | $1,482 | $75,171 | $8,000 | $67,171 |
| 2024 | $1,482 | $75,171 | $8,000 | $67,171 |
| 2023 | $1,441 | $54,434 | $7,600 | $46,834 |
| 2022 | $774 | $34,808 | $2,100 | $32,708 |
| 2021 | $775 | $34,808 | $2,100 | $32,708 |
| 2020 | $789 | $34,808 | $2,100 | $32,708 |
| 2019 | $797 | $34,808 | $2,100 | $32,708 |
| 2018 | $804 | $34,808 | $2,100 | $32,708 |
| 2017 | $794 | $34,808 | $2,100 | $32,708 |
| 2016 | $966 | $31,848 | $2,100 | $29,748 |
| 2014 | -- | $31,848 | $2,100 | $29,748 |
| 2013 | -- | $31,848 | $2,100 | $29,748 |
Source: Public Records
Map
Nearby Homes
- 1709 Needham Dr
- 1802 Malone Dr
- 1800 Malone Dr
- 440 Florence Ave
- 439 Florence Ave
- 450 Florence Ave
- 191 Hanks Bend
- 1632 Rio Vista Dr
- 115& 134 Independence Way
- 1230 W Lakeshore Dr W
- 171 Bear Den Ct
- 920 Sunset Cir
- 434 Liberty Dr
- 124 Levi Dr
- 1300 Belmont Dr
- 924 Stoneleigh Rd
- 1541 Threadmill Rd
- 719 Cavender Rd SE
- 911 Brookwood Dr
- 0 Lakemont Dr Unit 10664970
- 209 E Ezzard Ave
- 209 E Ezzard Ave
- 301 E Ezzard Ave
- 1737 Needham Dr
- 1728 Needham Dr
- 212 E Ezzard Ave
- 1729 Needham Dr
- 1726 Needham Dr
- 1739 Needham Dr
- 1739 Needham Dr
- 1725 Needham Dr
- 202 E Ezzard Ave
- 1803 Waverly Dr
- 203 E Ezzard Ave
- 1720 Needham Dr
- 200 E Ezzard Ave
- 1805 City View St
- 1717 Needham Dr
- 1807 Waverly Dr
- 1809 City View St
Your Personal Tour Guide
Ask me questions while you tour the home.