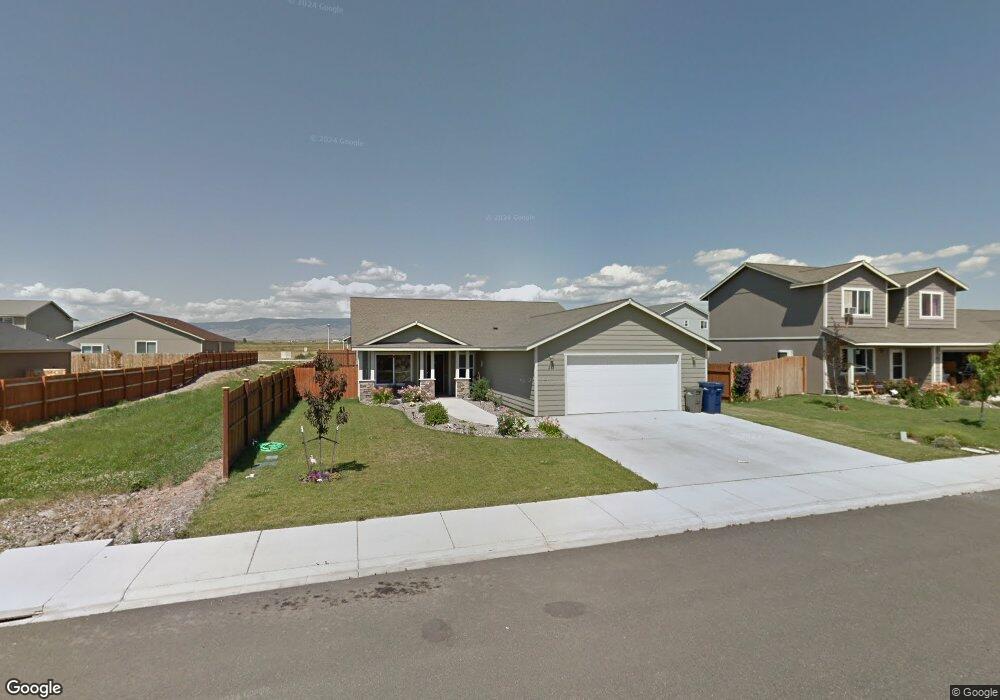
211 E Kristen Ave Unit 73 Ellensburg, WA 98926
Estimated Value: $426,948 - $517,000
3
Beds
2
Baths
1,554
Sq Ft
$300/Sq Ft
Est. Value
About This Home
This home is located at 211 E Kristen Ave Unit 73, Ellensburg, WA 98926 and is currently estimated at $466,737, approximately $300 per square foot. 211 E Kristen Ave Unit 73 is a home located in Kittitas County with nearby schools including Creative Kids Learning Center and Ellensburg Christian School.
Ownership History
Date
Name
Owned For
Owner Type
Purchase Details
Closed on
Oct 13, 2022
Sold by
Conner Hillary E
Bought by
Sloan Caren
Current Estimated Value
Purchase Details
Closed on
Jul 29, 2019
Sold by
Harris Tyler and Harris Gina
Bought by
Conner Hillary E
Home Financials for this Owner
Home Financials are based on the most recent Mortgage that was taken out on this home.
Original Mortgage
$216,750
Interest Rate
3.8%
Mortgage Type
New Conventional
Purchase Details
Closed on
May 12, 2016
Sold by
Ludlow Nicholas S
Bought by
Harris Tyler J
Home Financials for this Owner
Home Financials are based on the most recent Mortgage that was taken out on this home.
Original Mortgage
$211,105
Interest Rate
3.71%
Mortgage Type
FHA
Purchase Details
Closed on
Mar 2, 2016
Sold by
Ludlow Nicholas S
Bought by
Ludlow Nicholas S
Purchase Details
Closed on
Mar 17, 2009
Sold by
Cascade View Inc
Bought by
Ludlow Alice
Create a Home Valuation Report for This Property
The Home Valuation Report is an in-depth analysis detailing your home's value as well as a comparison with similar homes in the area
Home Values in the Area
Average Home Value in this Area
Purchase History
| Date | Buyer | Sale Price | Title Company |
|---|---|---|---|
| Sloan Caren | -- | -- | |
| Conner Hillary E | $289,000 | First American Mortgage Sln | |
| Harris Tyler J | $243,667 | Amt | |
| Ludlow Nicholas S | -- | None Available | |
| Ludlow Alice | $180,000 | Amerititle |
Source: Public Records
Mortgage History
| Date | Status | Borrower | Loan Amount |
|---|---|---|---|
| Previous Owner | Conner Hillary E | $216,750 | |
| Previous Owner | Harris Tyler J | $211,105 |
Source: Public Records
Tax History Compared to Growth
Tax History
| Year | Tax Paid | Tax Assessment Tax Assessment Total Assessment is a certain percentage of the fair market value that is determined by local assessors to be the total taxable value of land and additions on the property. | Land | Improvement |
|---|---|---|---|---|
| 2025 | $7,192 | $379,740 | $122,800 | $256,940 |
| 2023 | $3,589 | $344,310 | $92,840 | $251,470 |
| 2022 | $3,225 | $287,520 | $72,200 | $215,320 |
| 2021 | $3,159 | $266,340 | $61,600 | $204,740 |
| 2019 | $2,638 | $215,100 | $46,200 | $168,900 |
| 2018 | $2,406 | $200,880 | $46,200 | $154,680 |
| 2017 | $2,273 | $163,300 | $35,000 | $128,300 |
| 2016 | $2,198 | $163,300 | $35,000 | $128,300 |
| 2015 | $1,990 | $163,300 | $35,000 | $128,300 |
| 2013 | -- | $163,300 | $35,000 | $128,300 |
Source: Public Records
Map
Nearby Homes
- 300 E Country Side Ave
- 101 E Kristen Ave
- 203 E Chason Ave
- 2514 N Benjamin Ln
- 501 E Country Side Ave
- 400 E Heatherstone Ct
- 405 E Chason Ave
- 101 W Courtney Ct
- 402 E Heatherstone Ct
- 305 E Stanford Ave
- 2908 N Yale Ct
- 2510 N Spar Ln
- 430 N Gail Rd
- 201 E Chinook Rd Unit Lot 10
- 201 E Chinook Rd
- 204 E Ian Ave
- 202 E Ian Ave
- 508 W Bender Rd
- 400 E 24th Ave
- 2304 N Ellington St
- 211 E Kristen Ave
- 301 E Kristen Ave Unit 72
- 301 E Kristen Ave
- 207 E Kristen Ave
- 212 E 28th Ave
- 303 E Kristen Ave Unit 71
- 303 E Kristen Ave
- 300 E 28th Ave
- 208 E 28th Ave
- 205 E Kristen Ave Unit 75
- 205 E Kristen Ave Unit 74
- 205 E Kristen Ave
- 212 E Kristen Ave Unit 88
- 212 E Kristen Ave
- 302 E 28th Ave
- 300 E Kristen Ave Unit 89
- 305 E Kristen Ave Unit 70
- 305 E Kristen Ave
- 208 E Kristen Ave Unit 87
- 208 E Kristen Ave