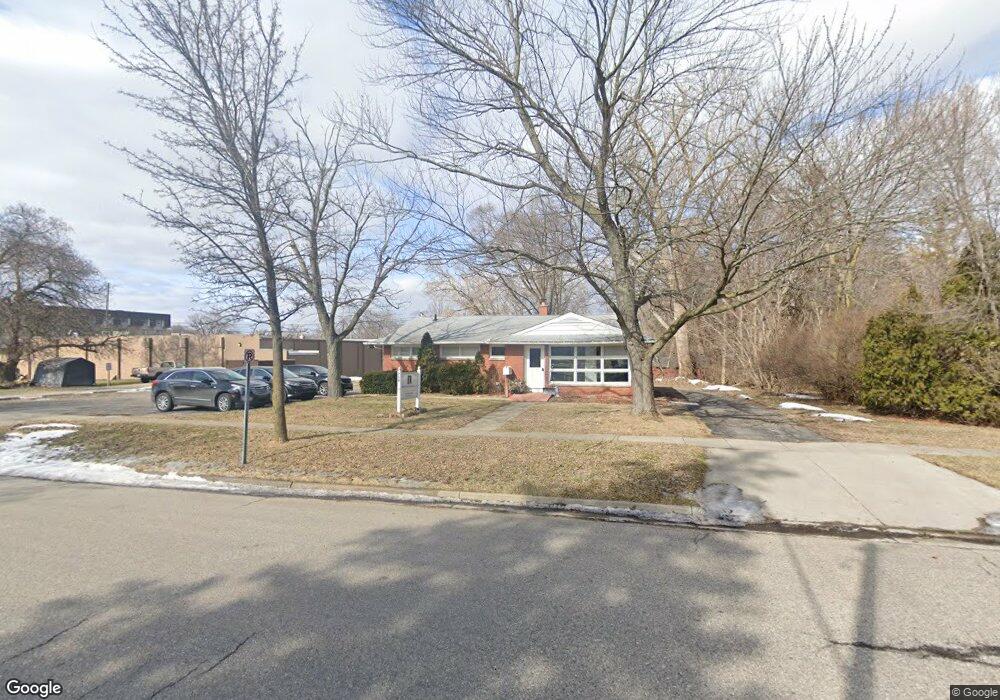
211 E South St Davison, MI 48423
Estimated Value: $275,633
Studio
--
Bath
1,515
Sq Ft
$182/Sq Ft
Est. Value
About This Home
This home is located at 211 E South St, Davison, MI 48423 and is currently estimated at $275,633, approximately $181 per square foot. 211 E South St is a home located in Genesee County with nearby schools including Thomson Elementary School, Hill Elementary School, and Gates Elementary School.
Ownership History
Date
Name
Owned For
Owner Type
Purchase Details
Closed on
Jun 14, 2019
Sold by
Swan Stuart and Swan Leslie
Bought by
Bfgf Llc
Current Estimated Value
Home Financials for this Owner
Home Financials are based on the most recent Mortgage that was taken out on this home.
Original Mortgage
$144,000
Outstanding Balance
$126,355
Interest Rate
4%
Mortgage Type
Commercial
Estimated Equity
$149,558
Purchase Details
Closed on
Aug 8, 2008
Sold by
Plymale Richard W and Plymale Janice K
Bought by
Swan Stuart E and Swan Leslie E
Home Financials for this Owner
Home Financials are based on the most recent Mortgage that was taken out on this home.
Original Mortgage
$108,000
Interest Rate
6.42%
Mortgage Type
Commercial
Purchase Details
Closed on
Mar 16, 2000
Sold by
Plymale Richard R
Bought by
Plymale Richard W and Plymale Janice K
Create a Home Valuation Report for This Property
The Home Valuation Report is an in-depth analysis detailing your home's value as well as a comparison with similar homes in the area
Home Values in the Area
Average Home Value in this Area
Purchase History
| Date | Buyer | Sale Price | Title Company |
|---|---|---|---|
| Bfgf Llc | $180,000 | Mason Burgess Title Agency | |
| Swan Stuart E | $135,000 | Sargents Title Company | |
| Plymale Richard W | -- | -- |
Source: Public Records
Mortgage History
| Date | Status | Borrower | Loan Amount |
|---|---|---|---|
| Open | Bfgf Llc | $144,000 | |
| Previous Owner | Swan Stuart E | $108,000 |
Source: Public Records
Tax History
| Year | Tax Paid | Tax Assessment Tax Assessment Total Assessment is a certain percentage of the fair market value that is determined by local assessors to be the total taxable value of land and additions on the property. | Land | Improvement |
|---|---|---|---|---|
| 2025 | $5,714 | $93,700 | $0 | $0 |
| 2024 | $2,479 | $87,500 | $0 | $0 |
| 2023 | $2,363 | $84,400 | $0 | $0 |
| 2022 | $5,146 | $78,900 | $0 | $0 |
| 2021 | $4,983 | $78,600 | $0 | $0 |
| 2020 | $2,066 | $76,000 | $0 | $0 |
| 2019 | $3,469 | $68,100 | $0 | $0 |
| 2018 | $3,818 | $63,100 | $0 | $0 |
| 2017 | $3,699 | $64,200 | $0 | $0 |
| 2016 | $3,667 | $63,700 | $0 | $0 |
| 2015 | $3,669 | $59,500 | $0 | $0 |
| 2012 | -- | $59,000 | $16,400 | $42,600 |
Source: Public Records
Map
Nearby Homes
- 322 North Dr
- 334 E Clark St Unit 340 344
- 216 N Genesee St
- 0000 S State Rd
- 505 N Main St
- 801 Hemlock Dr
- 10294 Carriage Way
- 612 Carriage Way
- 817 Hemlock Dr
- 511 Garland St
- 230 W Flint St
- 603 E Chelsea Cir
- 0 Davison Rd Unit 218068693
- 726 W 2nd St
- 625 Charles St
- 9469 Parkwood N Unit 2B
- 611 W Flint St
- 000 Davison Rd
- 1084 Linda Dr
- 730 Natalia Dr
Your Personal Tour Guide
Ask me questions while you tour the home.