
Landlord's Agent in 2025
Candi Guthrie
Coldwell Banker Realty
(949) 633-4663
2 in this area
25 Total Sales
Estimated Value: $3,839,000 - $6,209,000
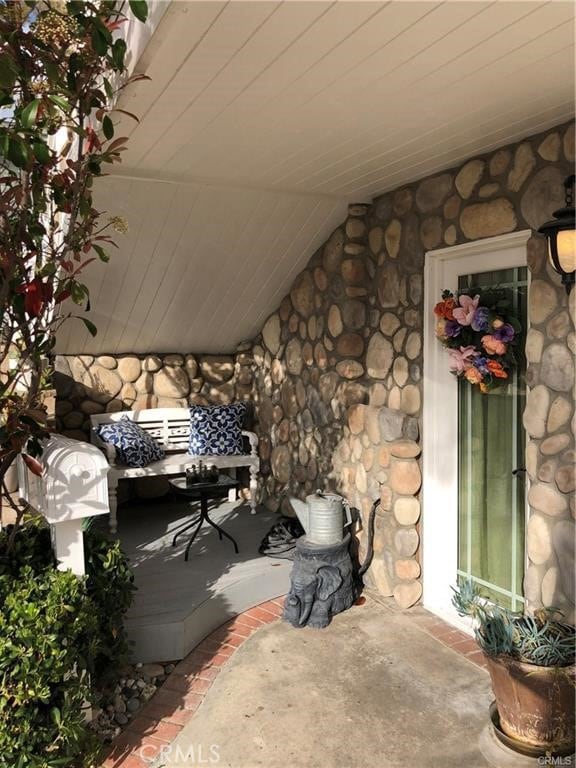
Welcome home to this beautifully appointed, FURNISHED, beach close, STUDIO. Available 8/31/25. It is located in the most desirable 'Southwest San Clemente', near the famous T-STREET beach. It features a full kitchen with fridge. YES, there is plenty of storage including a walk-in closet to boot!! This is a furnished rental. Utilities are $150 mo. There is a $25 addl. monthly fee for internet, the Wifi is optional.
Last Agent to Rent the Property
Coldwell Banker Realty Brokerage Phone: 949-633-4663 License #01257310 Listed on: 07/16/2025
Last Renter's Agent
Coldwell Banker Realty Brokerage Phone: 949-633-4663 License #01257310 Listed on: 07/16/2025
| Date | Buyer | Sale Price | Title Company |
|---|---|---|---|
| Yehle Ii Frank R | -- | Ticor Title Co Of Ca | |
| Yehle Ii Frank R | $325,000 | Old Republic Title Ins Co | |
| Wells Fargo Bank | $462,754 | Benefit Land Title Co |
| Date | Status | Borrower | Loan Amount |
|---|---|---|---|
| Open | Yehle Ii Frank R | $805,000 | |
| Closed | Yehle Ii Frank R | $227,500 |
| Date | Event | Price | List to Sale | Price per Sq Ft |
|---|---|---|---|---|
| 07/21/2025 07/21/25 | Rented | $2,600 | +8.3% | -- |
| 07/19/2025 07/19/25 | Under Contract | -- | -- | -- |
| 07/16/2025 07/16/25 | For Rent | $2,400 | +2.1% | -- |
| 05/07/2025 05/07/25 | Rented | $2,350 | 0.0% | -- |
| 05/05/2025 05/05/25 | Off Market | $2,350 | -- | -- |
| 04/30/2025 04/30/25 | For Rent | $2,350 | 0.0% | -- |
| 03/28/2025 03/28/25 | Off Market | $2,350 | -- | -- |
| 03/28/2025 03/28/25 | For Rent | $2,350 | 0.0% | -- |
| 12/25/2024 12/25/24 | Off Market | $2,350 | -- | -- |
| 12/25/2024 12/25/24 | For Rent | $2,350 | 0.0% | -- |
| 02/16/2024 02/16/24 | Off Market | $2,350 | -- | -- |
| 02/16/2024 02/16/24 | For Rent | $2,350 | 0.0% | -- |
| 12/18/2023 12/18/23 | Off Market | $2,350 | -- | -- |
| 11/12/2023 11/12/23 | For Rent | $2,350 | 0.0% | -- |
| 09/19/2023 09/19/23 | Off Market | $2,350 | -- | -- |
| 08/04/2023 08/04/23 | For Rent | $2,350 | +2.2% | -- |
| 08/30/2022 08/30/22 | For Rent | $2,300 | 0.0% | -- |
| 08/29/2022 08/29/22 | Rented | $2,300 | 0.0% | -- |
| 08/25/2022 08/25/22 | Off Market | $2,300 | -- | -- |
| 08/18/2022 08/18/22 | For Rent | $2,300 | +46.0% | -- |
| 12/18/2018 12/18/18 | Rented | $1,575 | 0.0% | -- |
| 12/16/2018 12/16/18 | Under Contract | -- | -- | -- |
| 12/15/2018 12/15/18 | Off Market | $1,575 | -- | -- |
| 12/08/2018 12/08/18 | For Rent | $1,575 | 0.0% | -- |
| 08/11/2018 08/11/18 | Rented | $1,575 | 0.0% | -- |
| 08/10/2018 08/10/18 | Under Contract | -- | -- | -- |
| 08/10/2018 08/10/18 | Off Market | $1,575 | -- | -- |
| 08/04/2018 08/04/18 | For Rent | $1,575 | 0.0% | -- |
| 07/13/2018 07/13/18 | Rented | $1,575 | 0.0% | -- |
| 07/02/2018 07/02/18 | For Rent | $1,575 | -73.5% | -- |
| 04/24/2018 04/24/18 | Rented | $5,950 | 0.0% | -- |
| 04/20/2018 04/20/18 | Under Contract | -- | -- | -- |
| 04/05/2018 04/05/18 | Price Changed | $5,950 | -0.2% | $1 / Sq Ft |
| 04/03/2018 04/03/18 | For Rent | $5,959 | 0.0% | -- |
| 03/30/2018 03/30/18 | Off Market | $5,959 | -- | -- |
| 03/16/2018 03/16/18 | Rented | $1,575 | 0.0% | -- |
| 03/16/2018 03/16/18 | Under Contract | -- | -- | -- |
| 03/12/2018 03/12/18 | For Rent | $1,575 | -- | -- |
| Year | Tax Paid | Tax Assessment Tax Assessment Total Assessment is a certain percentage of the fair market value that is determined by local assessors to be the total taxable value of land and additions on the property. | Land | Improvement |
|---|---|---|---|---|
| 2025 | $11,038 | $1,118,006 | $331,941 | $786,065 |
| 2024 | $11,038 | $1,096,085 | $325,433 | $770,652 |
| 2023 | $10,803 | $1,074,594 | $319,052 | $755,542 |
| 2022 | $10,596 | $1,053,524 | $312,796 | $740,728 |
| 2021 | $10,390 | $1,032,867 | $306,663 | $726,204 |
| 2020 | $10,286 | $1,022,277 | $303,519 | $718,758 |
| 2019 | $10,083 | $1,002,233 | $297,568 | $704,665 |
| 2018 | $9,888 | $982,582 | $291,733 | $690,849 |
| 2017 | $9,693 | $963,316 | $286,013 | $677,303 |
| 2016 | $9,506 | $944,428 | $280,405 | $664,023 |
| 2015 | $9,362 | $930,242 | $276,193 | $654,049 |
| 2014 | $9,182 | $912,020 | $270,782 | $641,238 |
Landlord's Agent in 2025
Candi Guthrie
Coldwell Banker Realty
(949) 633-4663
2 in this area
25 Total Sales
J
Buyer's Agent in 2025
Jacqueline Brownhopper
Beach Cities Real Estate
(949) 285-5292
19 Total Sales
Buyer's Agent in 2018
Laura Ventura
CENTURY 21 Affiliated
(949) 412-5148
8 Total Sales
Source: California Regional Multiple Listing Service (CRMLS)
MLS Number: OC25159614
APN: 692-242-05
Disclaimer: Certain information contained herein is derived from information provided by parties other than Homes.com. All information provided is deemed reliable, but is not guaranteed to be accurate and should be independently verified.
![]() The multiple listing data appearing on this website, or contained in reports produced therefrom, is owned and copyrighted by California Regional Multiple Listing Service, Inc. ("CRMLS") and is protected by all applicable copyright laws. Information provided is for viewer's personal, non-commercial use and may not be used for any purpose other than to identify prospective properties the viewer may be interested in purchasing. All listing data, including but not limited to square footage and lot size is believed to be accurate, but the listing Agent, listing Broker and CRMLS and its affiliates do not warrant or guarantee such accuracy. The viewer should independently verify the listed data prior to making any decisions based on such information by personal inspection and/or contacting a real estate professional.
The multiple listing data appearing on this website, or contained in reports produced therefrom, is owned and copyrighted by California Regional Multiple Listing Service, Inc. ("CRMLS") and is protected by all applicable copyright laws. Information provided is for viewer's personal, non-commercial use and may not be used for any purpose other than to identify prospective properties the viewer may be interested in purchasing. All listing data, including but not limited to square footage and lot size is believed to be accurate, but the listing Agent, listing Broker and CRMLS and its affiliates do not warrant or guarantee such accuracy. The viewer should independently verify the listed data prior to making any decisions based on such information by personal inspection and/or contacting a real estate professional.
Based on information from California Regional Multiple Listing Service, Inc. and /or other sources. All data, including all measurements and calculations of area, is obtained from various sources and has not been, and will not be, verified by broker or MLS. All information should be independently reviewed and verified for accuracy. Properties may or may not be listed by the office/agent presenting the information
Ask me questions while you tour the home.