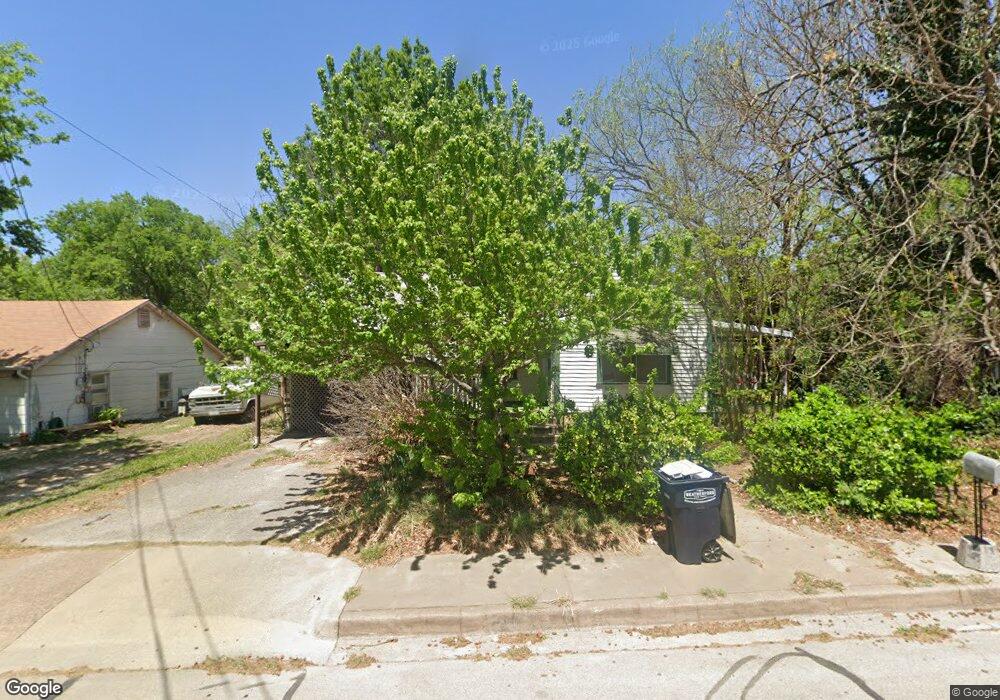
211 Front St Weatherford, TX 76086
Estimated Value: $197,918 - $235,000
3
Beds
1
Bath
1,255
Sq Ft
$173/Sq Ft
Est. Value
About This Home
This home is located at 211 Front St, Weatherford, TX 76086 and is currently estimated at $217,730, approximately $173 per square foot. 211 Front St is a home located in Parker County with nearby schools including Seguin Elementary School, Tison Middle School, and Weatherford High School.
Ownership History
Date
Name
Owned For
Owner Type
Purchase Details
Closed on
Jul 17, 2015
Sold by
Flanagan Dan and Flanagan Annie
Bought by
Galbreaith Donicia Delynn
Current Estimated Value
Home Financials for this Owner
Home Financials are based on the most recent Mortgage that was taken out on this home.
Original Mortgage
$35,000
Outstanding Balance
$22,510
Interest Rate
6.25%
Mortgage Type
Purchase Money Mortgage
Estimated Equity
$195,221
Purchase Details
Closed on
Jul 28, 2006
Sold by
Tiner Hite
Bought by
Galbreaith Donicia Delynn
Purchase Details
Closed on
Feb 24, 1984
Bought by
Galbreaith Donicia Delynn
Create a Home Valuation Report for This Property
The Home Valuation Report is an in-depth analysis detailing your home's value as well as a comparison with similar homes in the area
Home Values in the Area
Average Home Value in this Area
Purchase History
| Date | Buyer | Sale Price | Title Company |
|---|---|---|---|
| Galbreaith Donicia Delynn | -- | Providence Title Company | |
| Galbreaith Donicia Delynn | -- | -- | |
| Galbreaith Donicia Delynn | -- | -- |
Source: Public Records
Mortgage History
| Date | Status | Borrower | Loan Amount |
|---|---|---|---|
| Open | Galbreaith Donicia Delynn | $35,000 |
Source: Public Records
Tax History Compared to Growth
Tax History
| Year | Tax Paid | Tax Assessment Tax Assessment Total Assessment is a certain percentage of the fair market value that is determined by local assessors to be the total taxable value of land and additions on the property. | Land | Improvement |
|---|---|---|---|---|
| 2025 | $1,105 | $122,162 | -- | -- |
| 2024 | $1,105 | $111,056 | -- | -- |
| 2023 | $1,105 | $100,960 | $0 | $0 |
| 2022 | $2,036 | $91,790 | $15,000 | $76,790 |
| 2021 | $2,138 | $91,790 | $15,000 | $76,790 |
| 2020 | $1,956 | $80,950 | $15,000 | $65,950 |
| 2019 | $1,995 | $80,950 | $15,000 | $65,950 |
| 2018 | $1,822 | $71,030 | $15,000 | $56,030 |
| 2017 | $1,869 | $71,030 | $15,000 | $56,030 |
| 2016 | $1,549 | $58,860 | $15,000 | $43,860 |
| 2015 | $278 | $58,860 | $15,000 | $43,860 |
| 2014 | $274 | $54,780 | $15,000 | $39,780 |
Source: Public Records
Map
Nearby Homes