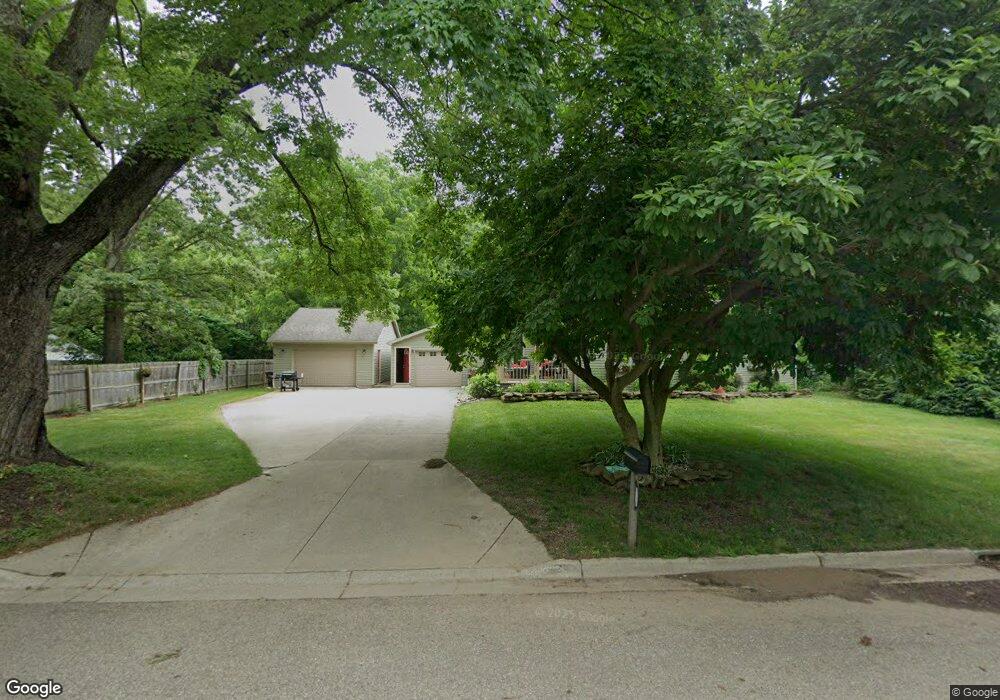
211 Knapp St Allegan, MI 49010
Estimated Value: $244,000 - $302,000
3
Beds
2
Baths
1,236
Sq Ft
$219/Sq Ft
Est. Value
About This Home
This home is located at 211 Knapp St, Allegan, MI 49010 and is currently estimated at $270,069, approximately $218 per square foot. 211 Knapp St is a home located in Allegan County with nearby schools including West Ward Elementary School, L.E. White Middle School, and Allegan High School.
Ownership History
Date
Name
Owned For
Owner Type
Purchase Details
Closed on
Jun 16, 2010
Sold by
Thompson Ashley J and Mock Ashley J
Bought by
Reimink Mickey L and Reimink Danielle S
Current Estimated Value
Home Financials for this Owner
Home Financials are based on the most recent Mortgage that was taken out on this home.
Original Mortgage
$105,317
Outstanding Balance
$72,393
Interest Rate
5.5%
Mortgage Type
FHA
Estimated Equity
$197,676
Purchase Details
Closed on
Jul 30, 2007
Sold by
Mortgage Electronic Registration Systems
Bought by
Deutsche Bank Trust Co America
Purchase Details
Closed on
Jul 19, 2007
Sold by
Lafountain Mark and Lafountain Jaime
Bought by
Mortgage Electronic Registration Systems
Purchase Details
Closed on
Jan 9, 2006
Sold by
Lafountain Mark
Bought by
Lafountain Mark and Lafountain Jamie
Home Financials for this Owner
Home Financials are based on the most recent Mortgage that was taken out on this home.
Original Mortgage
$75,100
Interest Rate
8.5%
Mortgage Type
New Conventional
Purchase Details
Closed on
Jul 20, 2005
Sold by
Bayview Financial Property Trust
Bought by
Lafountain Mark
Home Financials for this Owner
Home Financials are based on the most recent Mortgage that was taken out on this home.
Original Mortgage
$52,000
Interest Rate
5.74%
Mortgage Type
Purchase Money Mortgage
Purchase Details
Closed on
Apr 26, 2005
Sold by
Jones Kris
Bought by
Bayview Financial Property Trust
Purchase Details
Closed on
Apr 12, 2002
Sold by
Horton Sherrie Diane
Bought by
Jones Kris Lee and Allen Jennifer Rachelle
Purchase Details
Closed on
Jul 7, 1999
Sold by
Horton Sherrie and Jones Kris
Bought by
Horton Sherrie
Purchase Details
Closed on
Apr 2, 1999
Sold by
Horton Sherrie D
Bought by
Horton Sherrie and Jones Kris
Purchase Details
Closed on
Sep 30, 1997
Sold by
Brokus Stanley and Brokus Augusta
Bought by
Clemes Mila A
Purchase Details
Closed on
Apr 3, 1997
Bought by
Clemens Mila A
Purchase Details
Closed on
Nov 24, 1989
Sold by
Brokus Stanley and Brokus Augusta
Bought by
Zantello and Zantello Clemens
Create a Home Valuation Report for This Property
The Home Valuation Report is an in-depth analysis detailing your home's value as well as a comparison with similar homes in the area
Home Values in the Area
Average Home Value in this Area
Purchase History
| Date | Buyer | Sale Price | Title Company |
|---|---|---|---|
| Reimink Mickey L | $109,000 | Chicago Title | |
| Deutsche Bank Trust Co America | -- | E Title Agency | |
| Mortgage Electronic Registration Systems | $85,000 | None Available | |
| Lafountain Mark | -- | Title Quest Agency | |
| Lafountain Mark | $45,000 | Nta | |
| Bayview Financial Property Trust | $44,000 | Metropolitan Title Company | |
| Jones Kris Lee | -- | Metropolitan Title Company | |
| Horton Sherrie | -- | -- | |
| Horton Sherrie | -- | -- | |
| Clemes Mila A | $40,000 | -- | |
| Clemens Mila A | $32,400 | -- | |
| Zantello | -- | -- |
Source: Public Records
Mortgage History
| Date | Status | Borrower | Loan Amount |
|---|---|---|---|
| Open | Reimink Mickey L | $105,317 | |
| Previous Owner | Lafountain Mark | $75,100 | |
| Previous Owner | Lafountain Mark | $52,000 |
Source: Public Records
Tax History Compared to Growth
Tax History
| Year | Tax Paid | Tax Assessment Tax Assessment Total Assessment is a certain percentage of the fair market value that is determined by local assessors to be the total taxable value of land and additions on the property. | Land | Improvement |
|---|---|---|---|---|
| 2025 | $2,475 | $135,300 | $22,500 | $112,800 |
| 2024 | $2,252 | $118,100 | $19,600 | $98,500 |
| 2023 | $2,334 | $103,100 | $18,600 | $84,500 |
| 2022 | $2,252 | $88,700 | $15,400 | $73,300 |
| 2021 | $2,153 | $84,200 | $12,300 | $71,900 |
| 2020 | $2,122 | $70,500 | $11,300 | $59,200 |
| 2019 | $2,070 | $65,200 | $9,400 | $55,800 |
| 2018 | $1,988 | $55,000 | $9,400 | $45,600 |
| 2017 | $0 | $51,400 | $8,100 | $43,300 |
| 2016 | $0 | $44,300 | $7,100 | $37,200 |
| 2015 | -- | $44,300 | $7,100 | $37,200 |
| 2014 | -- | $46,400 | $6,900 | $39,500 |
| 2013 | $1,928 | $50,100 | $6,900 | $43,200 |
Source: Public Records
Map
Nearby Homes