
Landlord's Agent in 2023
Hanneman and Gonzales Team
Compass
(617) 480-7775
12 in this area
116 Total Sales
Estimated Value: $1,087,000 - $1,485,000
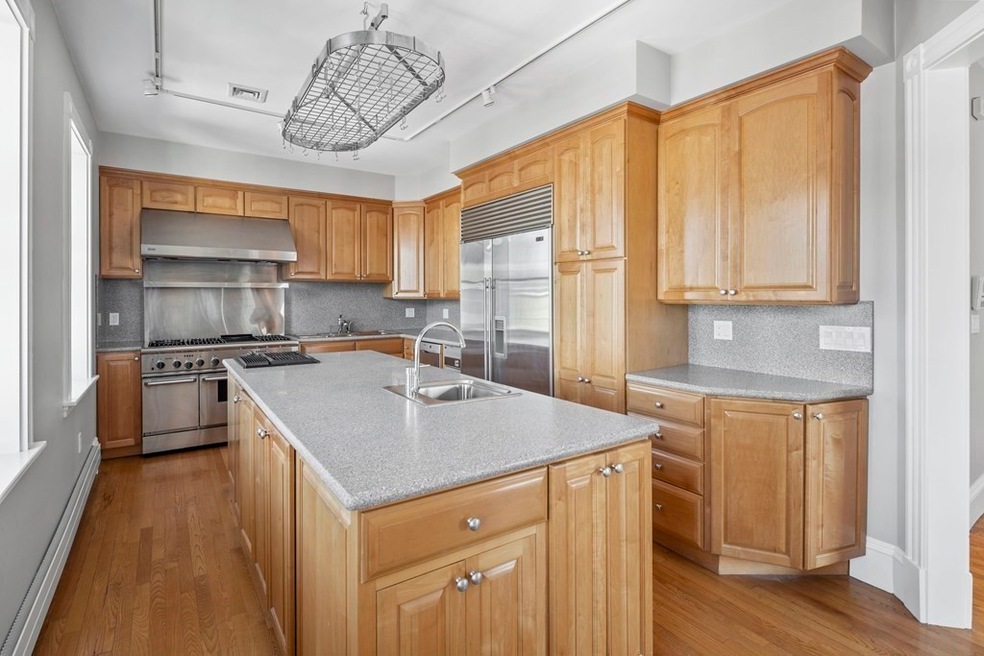
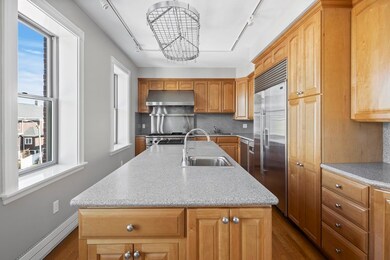
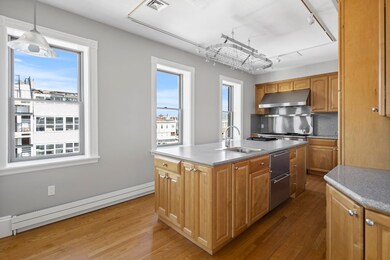
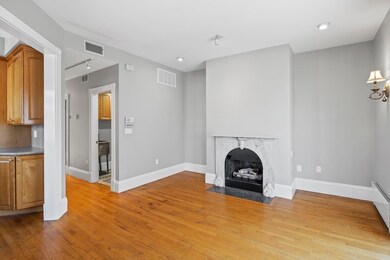
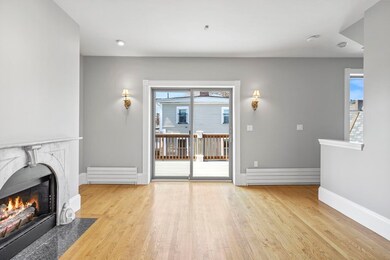
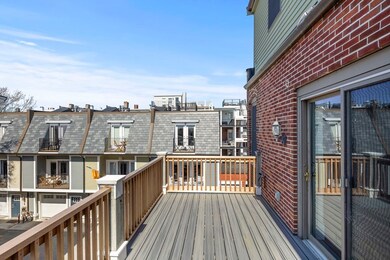
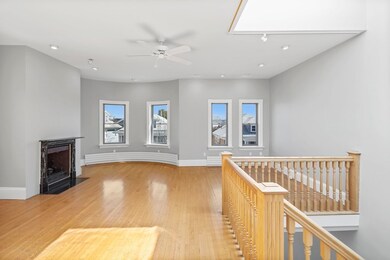
AVAILABLE NOW. Just completely repainted and refreshed! A+ South Boston location, just a stones throw from M St Beach! One-of-a-kind oversized one-bedroom, 2.5 bath penthouse duplex encompassing almost 2500 sqft. -- lives like a single family. This custom-designed condo features private entrance, hardwood floors throughout, decorative fireplaces, 2 large decks, private storage, recessed lighting, and central A/C. Additional highlights include suburban-sized chef's kitchen with professional Thermador range and Sub-Zero fridge with additional fridge drawers, wet bar, separate dining room with fireplace and direct-access deck, incredible primary suite with granite master bath w/ oversized jetted tub + walk-in shower and large custom walk-in closet and private direct-access deck, two large living rooms (one could function as office and/or guest space), large laundry room, and more. Two-unit well-maintained building, must be seen to be appreciated. On street parking available.
| Date | Buyer | Sale Price | Title Company |
|---|---|---|---|
| Alavi-Nassab Mohammad | $580,000 | -- |
| Date | Event | Price | List to Sale | Price per Sq Ft |
|---|---|---|---|---|
| 04/19/2023 04/19/23 | Rented | $4,000 | 0.0% | -- |
| 04/15/2023 04/15/23 | Under Contract | -- | -- | -- |
| 04/02/2023 04/02/23 | For Rent | $4,000 | +29.0% | -- |
| 06/11/2015 06/11/15 | Rented | $3,100 | 0.0% | -- |
| 06/11/2015 06/11/15 | For Rent | $3,100 | 0.0% | -- |
| 07/07/2014 07/07/14 | Rented | $3,100 | +3.3% | -- |
| 07/07/2014 07/07/14 | For Rent | $3,000 | -- | -- |
| Year | Tax Paid | Tax Assessment Tax Assessment Total Assessment is a certain percentage of the fair market value that is determined by local assessors to be the total taxable value of land and additions on the property. | Land | Improvement |
|---|---|---|---|---|
| 2025 | $12,965 | $1,119,600 | $0 | $1,119,600 |
| 2024 | $12,070 | $1,107,300 | $0 | $1,107,300 |
| 2023 | $11,651 | $1,084,800 | $0 | $1,084,800 |
| 2022 | $11,347 | $1,042,900 | $0 | $1,042,900 |
| 2021 | $10,910 | $1,022,500 | $0 | $1,022,500 |
| 2020 | $9,602 | $909,300 | $0 | $909,300 |
| 2019 | $8,960 | $850,100 | $0 | $850,100 |
| 2018 | $8,483 | $809,400 | $0 | $809,400 |
| 2017 | $8,012 | $756,600 | $0 | $756,600 |
| 2016 | $7,851 | $713,700 | $0 | $713,700 |
| 2015 | $8,687 | $717,300 | $0 | $717,300 |
| 2014 | $8,056 | $640,400 | $0 | $640,400 |
Landlord's Agent in 2023
Hanneman and Gonzales Team
Compass
(617) 480-7775
12 in this area
116 Total Sales
B
Landlord's Co-Listing Agent in 2023
Brett Mensinger
Corcoran Property Advisors
(609) 425-5084
3 in this area
62 Total Sales
L
Tenant's Agent in 2023
Lutfi Lutfi
Luxury Residential Group, LLC
(617) 222-0985
2 in this area
18 Total Sales
J
Buyer's Agent in 2015
Jim Fitzgerald
RE/MAX
N
Seller's Agent in 2014
Nick Hanneman
Compass
(617) 480-7775
1 in this area
5 Total Sales
T
Buyer's Agent in 2014
Tanner Payne
Apex Real Estate Group, LLC
(774) 218-1712
16 Total Sales
Source: MLS Property Information Network (MLS PIN)
MLS Number: 73094221
APN: SBOS-000000-000007-002512-000004
Disclaimer: Certain information contained herein is derived from information provided by parties other than Homes.com. All information provided is deemed reliable, but is not guaranteed to be accurate and should be independently verified.
![]() The property listing data and information, or the Images, set forth herein were provided to MLS Property Information Network, Inc. from third party sources, including sellers, lessors and public records, and were compiled by MLS Property Information Network, Inc. The property listing data and information, and the Images, are for the personal, non-commercial use of consumers having a good faith interest in purchasing or leasing listed properties of the type displayed to them and may not be used for any purpose other than to identify prospective properties which such consumers may have a good faith interest in purchasing or leasing. MLS Property Information Network, Inc. and its subscribers disclaim any and all representations and warranties as to the accuracy of the property listing data and information, or as to the accuracy of any of the Images, set forth herein.
The property listing data and information, or the Images, set forth herein were provided to MLS Property Information Network, Inc. from third party sources, including sellers, lessors and public records, and were compiled by MLS Property Information Network, Inc. The property listing data and information, and the Images, are for the personal, non-commercial use of consumers having a good faith interest in purchasing or leasing listed properties of the type displayed to them and may not be used for any purpose other than to identify prospective properties which such consumers may have a good faith interest in purchasing or leasing. MLS Property Information Network, Inc. and its subscribers disclaim any and all representations and warranties as to the accuracy of the property listing data and information, or as to the accuracy of any of the Images, set forth herein.