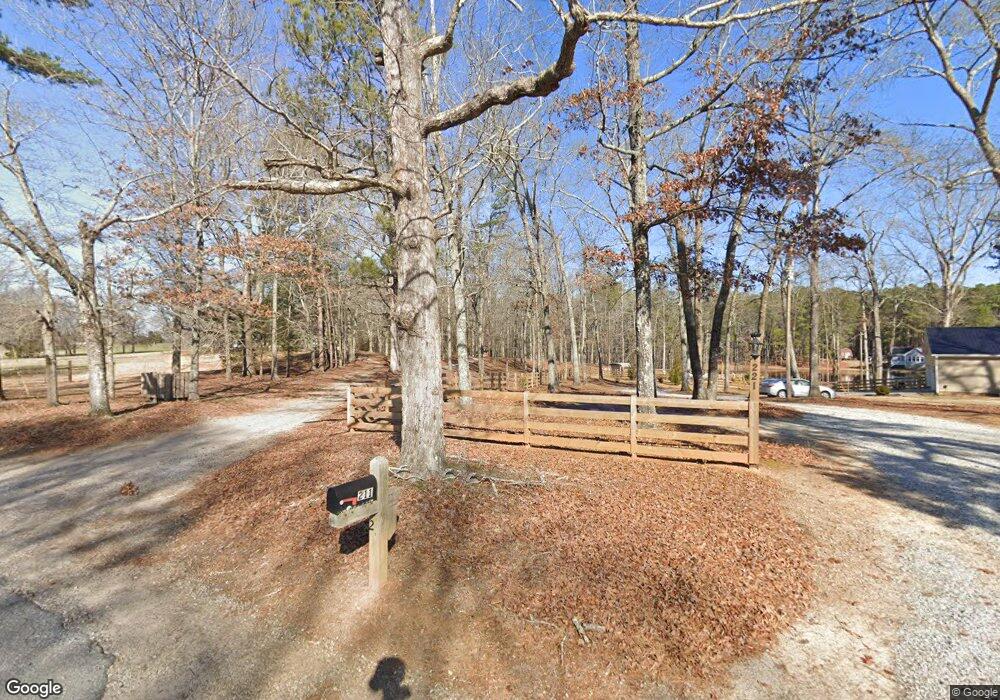
211 Martin Dairy Rd Milner, GA 30257
Estimated Value: $235,000 - $433,000
2
Beds
2
Baths
1,530
Sq Ft
$222/Sq Ft
Est. Value
About This Home
This home is located at 211 Martin Dairy Rd, Milner, GA 30257 and is currently estimated at $339,978, approximately $222 per square foot. 211 Martin Dairy Rd is a home located in Lamar County with nearby schools including Lamar County Primary School, Lamar County Elementary School, and Lamar County Middle School.
Ownership History
Date
Name
Owned For
Owner Type
Purchase Details
Closed on
Jan 9, 2014
Sold by
Beauchamp Robert
Bought by
Beauchamp Robert
Current Estimated Value
Purchase Details
Closed on
Mar 22, 2012
Sold by
Martin Helen
Bought by
Beauchamp Robert
Purchase Details
Closed on
Jun 20, 2009
Sold by
Martin Helen
Bought by
Beauchamp James Robert
Home Financials for this Owner
Home Financials are based on the most recent Mortgage that was taken out on this home.
Original Mortgage
$100,000
Interest Rate
4.79%
Mortgage Type
New Conventional
Purchase Details
Closed on
Jan 11, 2008
Sold by
Martin Mitchell A
Bought by
Beauchamp James Robert and Beauchamp Alice M
Purchase Details
Closed on
Jun 1, 2002
Bought by
Beauchamp Robert
Purchase Details
Closed on
Jan 11, 2001
Bought by
Beauchamp Robert and Beauchamp Alice
Create a Home Valuation Report for This Property
The Home Valuation Report is an in-depth analysis detailing your home's value as well as a comparison with similar homes in the area
Home Values in the Area
Average Home Value in this Area
Purchase History
| Date | Buyer | Sale Price | Title Company |
|---|---|---|---|
| Beauchamp Robert | -- | -- | |
| Beauchamp Robert | -- | -- | |
| Beauchamp James Robert | -- | -- | |
| Beauchamp James Robert | -- | -- | |
| Beauchamp James Robert | -- | -- | |
| Beauchamp Robert | -- | -- | |
| Beauchamp Robert | -- | -- |
Source: Public Records
Mortgage History
| Date | Status | Borrower | Loan Amount |
|---|---|---|---|
| Previous Owner | Beauchamp James Robert | $100,000 |
Source: Public Records
Tax History Compared to Growth
Tax History
| Year | Tax Paid | Tax Assessment Tax Assessment Total Assessment is a certain percentage of the fair market value that is determined by local assessors to be the total taxable value of land and additions on the property. | Land | Improvement |
|---|---|---|---|---|
| 2024 | $2,766 | $126,245 | $35,372 | $90,873 |
| 2023 | $1,809 | $109,324 | $35,372 | $73,952 |
| 2022 | $1,638 | $99,430 | $30,782 | $68,648 |
| 2021 | $1,378 | $86,068 | $30,782 | $55,286 |
| 2020 | $1,464 | $78,968 | $26,402 | $52,566 |
| 2019 | $1,702 | $74,156 | $26,402 | $47,754 |
| 2018 | $1,632 | $74,156 | $26,402 | $47,754 |
| 2017 | $1,621 | $74,156 | $26,402 | $47,754 |
| 2016 | $1,620 | $74,156 | $26,402 | $47,754 |
| 2015 | $1,612 | $85,185 | $37,431 | $47,754 |
| 2014 | $1,580 | $85,185 | $37,431 | $47,754 |
| 2013 | -- | $85,433 | $37,679 | $47,754 |
Source: Public Records
Map
Nearby Homes
- 121 Grape Creek Rd
- 0 Martin Dairy Rd Unit 10595359
- 381 Martin Dairy Rd
- 319 Mckenzie Rd
- 782 Mckenzie Rd
- 0 Trice Rd Unit 10284703
- 1345 Buffington Rd
- 105 Zebulon St
- 340 Tom Bell Rd
- 0 Magnolia Trace Unit 10551135
- 0 Magnolia Trace Unit 7604351
- 402 Tom Bell Rd
- 0 Wilson Rd Unit 10564610
- 215 Brown Springs Rd
- 134 Mathews Rd
- 186 Liberty Hill Rd
- 166 Mathews Rd
- 164 Mathews Rd
- 162 Mathews Rd
- 168 Mathews Rd
- 211 Martin Dairy Rd
- 221 Martin Dairy Rd
- 199 Martin Dairy Rd
- 222 Martin Dairy Rd
- 1134 Highway 41 N
- 102 Grape Creek Rd
- 162 Cauthen Rd
- 114 Grape Creek Rd
- 147 Cauthen Rd
- 256 Martin Dairy Rd
- 267 Martin Dairy Rd
- 171 Cauthen Rd
- 264 Martin Dairy Rd
- 216 Martin Dairy Rd
- 270 Martin Dairy Rd
- 0 Martin Dairy Rd Unit 2 8410897
- 0 Martin Dairy Rd Unit 1 8410837
- 00 Martin Dairy Rd
- 0 Martin Dairy Rd
- 0 Martin Dairy Rd Unit 20159430