Estimated Value: $336,839 - $532,000
--
Bed
--
Bath
2,158
Sq Ft
$193/Sq Ft
Est. Value
About This Home
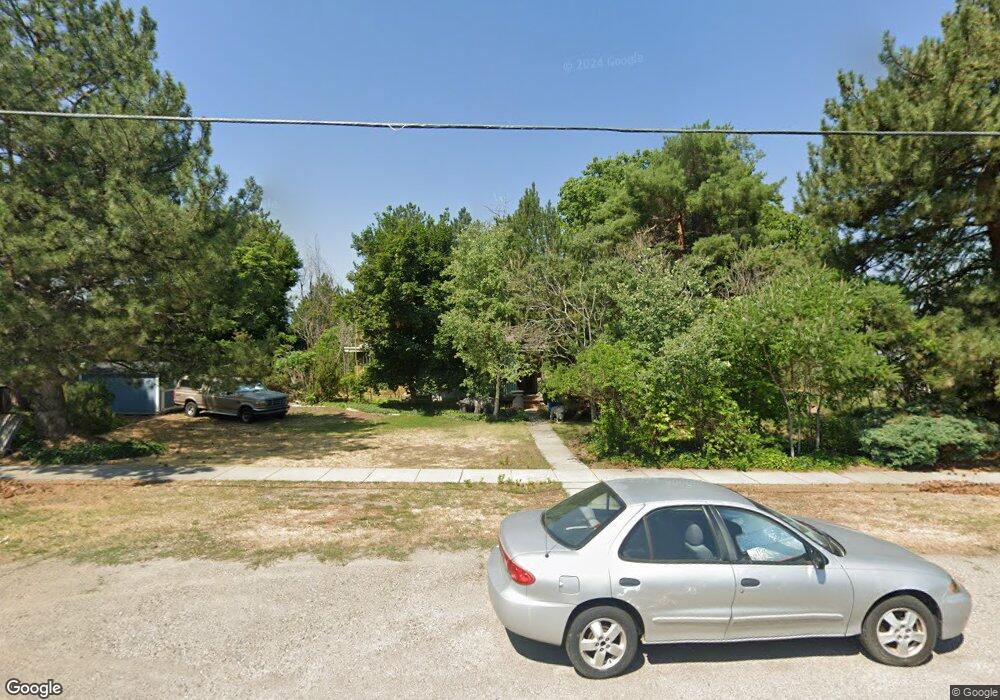
This home is located at 211 N 200 W, Hyrum, UT 84319 and is currently estimated at $416,210, approximately $192 per square foot. 211 N 200 W is a home with nearby schools including Lincoln School, South Cache Middle School, and Mountain Crest High School.
Ownership History
Date
Name
Owned For
Owner Type
Purchase Details
Closed on
Feb 24, 2021
Sold by
Mccracken Stan Lee and Brown Robyn Matthew
Bought by
Mccracken Stan L and Brown Robyn M
Current Estimated Value
Purchase Details
Closed on
Jan 18, 2011
Sold by
Brown Robyn Matthew
Bought by
Brown Robyn Matthew and Mccracken Stan Lee
Purchase Details
Closed on
Feb 24, 2007
Sold by
Brown Robyn M
Bought by
Brown Robyn Matthew and Mccracken Stan Lee
Create a Home Valuation Report for This Property
The Home Valuation Report is an in-depth analysis detailing your home's value as well as a comparison with similar homes in the area
Home Values in the Area
Average Home Value in this Area
Purchase History
| Date | Buyer | Sale Price | Title Company |
|---|---|---|---|
| Mccracken Stan L | -- | None Available | |
| Brown Robyn Matthew | -- | Hickman Land Title Company | |
| Brown Robyn Matthew | -- | Hickman Land Title Company |
Source: Public Records
Tax History Compared to Growth
Tax History
| Year | Tax Paid | Tax Assessment Tax Assessment Total Assessment is a certain percentage of the fair market value that is determined by local assessors to be the total taxable value of land and additions on the property. | Land | Improvement |
|---|---|---|---|---|
| 2025 | $1,172 | $168,305 | $0 | $0 |
| 2024 | $1,250 | $167,650 | $0 | $0 |
| 2023 | $131 | $167,500 | $0 | $0 |
| 2022 | $1,369 | $168,150 | $0 | $0 |
| 2021 | $1,259 | $238,339 | $69,880 | $168,459 |
| 2020 | $1,123 | $199,464 | $69,880 | $129,584 |
| 2019 | $1,064 | $177,724 | $48,140 | $129,584 |
| 2018 | $1,014 | $163,840 | $48,140 | $115,700 |
| 2017 | $944 | $79,110 | $0 | $0 |
| 2016 | $965 | $79,110 | $0 | $0 |
| 2015 | $968 | $79,110 | $0 | $0 |
| 2014 | $944 | $78,945 | $0 | $0 |
| 2013 | -- | $78,945 | $0 | $0 |
Source: Public Records
Map
Nearby Homes