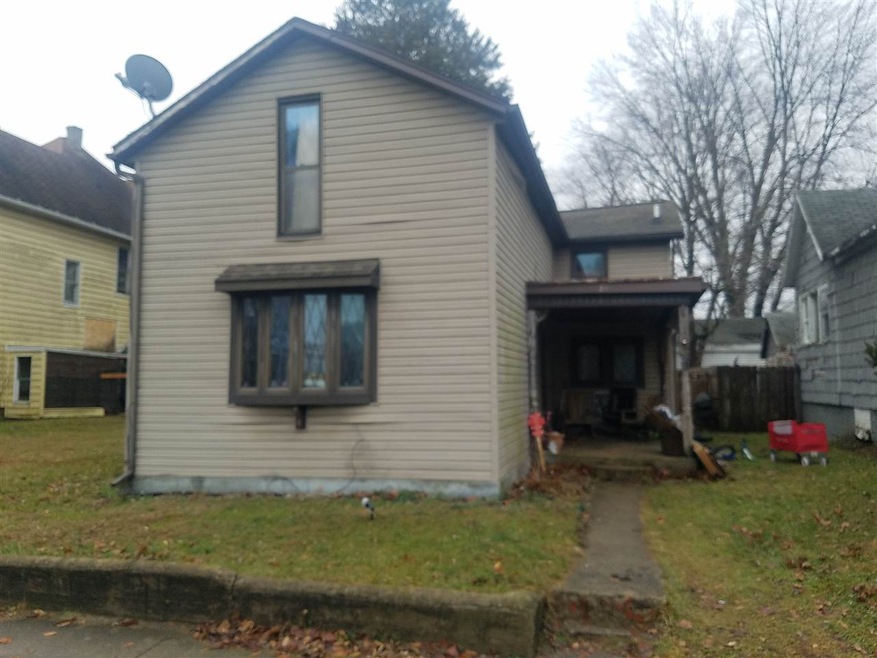
211 N Cicott St Logansport, IN 46947
Estimated Value: $87,000 - $129,000
Highlights
- Traditional Architecture
- Forced Air Heating and Cooling System
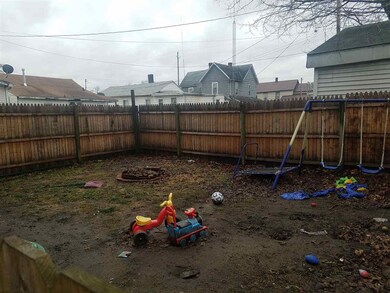
- Level Lot
About This Home
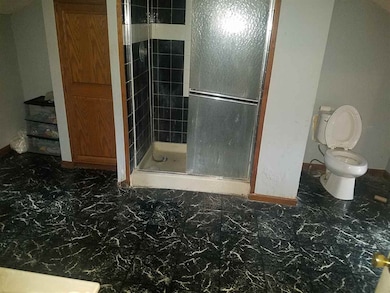
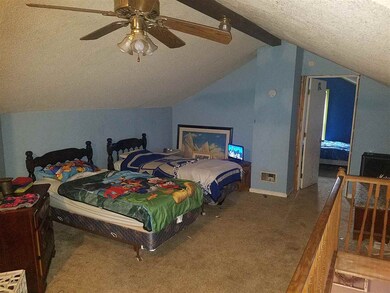
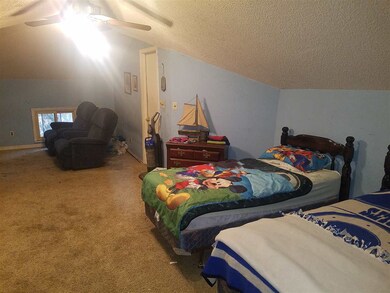
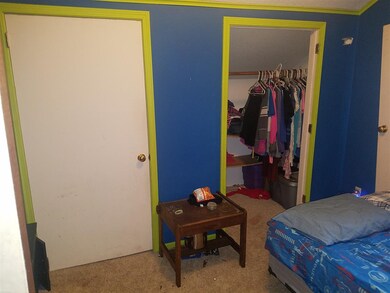
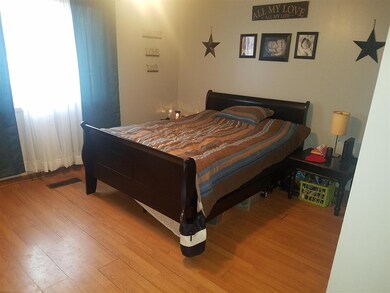
As of April 2018full bath on each level. Dormer style upstairs. Updated kitchen and bathroom are very nice. Privacy Fenced in back yard. The third bedroom was the front room downstairs
Home Details
Home Type
- Single Family
Est. Annual Taxes
- $168
Year Built
- Built in 1930
Lot Details
- 2,178 Sq Ft Lot
- Lot Dimensions are 30x83
- Level Lot
Home Design
- Traditional Architecture
- Vinyl Construction Material
Interior Spaces
- 2-Story Property
- Partially Finished Basement
- Stone or Rock in Basement
Bedrooms and Bathrooms
- 3 Bedrooms
Utilities
- Forced Air Heating and Cooling System
- Heating System Uses Gas
Listing and Financial Details
- Assessor Parcel Number 09-17-56-477-004.000-010
Ownership History
Purchase Details
Home Financials for this Owner
Home Financials are based on the most recent Mortgage that was taken out on this home.Home Values in the Area
Average Home Value in this Area
Purchase History
| Date | Buyer | Sale Price | Title Company |
|---|---|---|---|
| Red Investments Llc | -- | Attorney Only |
Property History
| Date | Event | Price | List to Sale | Price per Sq Ft |
|---|---|---|---|---|
| 04/26/2018 04/26/18 | Sold | $33,000 | -29.8% | $20 / Sq Ft |
| 01/22/2018 01/22/18 | For Sale | $47,000 | -- | $29 / Sq Ft |
Tax History Compared to Growth
Tax History
| Year | Tax Paid | Tax Assessment Tax Assessment Total Assessment is a certain percentage of the fair market value that is determined by local assessors to be the total taxable value of land and additions on the property. | Land | Improvement |
|---|---|---|---|---|
| 2024 | $455 | $51,200 | $4,300 | $46,900 |
| 2022 | $387 | $38,700 | $4,300 | $34,400 |
| 2021 | $304 | $30,400 | $4,100 | $26,300 |
| 2020 | $280 | $28,000 | $4,100 | $23,900 |
| 2019 | $259 | $25,900 | $4,100 | $21,800 |
| 2018 | $163 | $25,900 | $4,100 | $21,800 |
| 2017 | $166 | $25,700 | $4,100 | $21,600 |
| 2016 | $168 | $27,300 | $4,100 | $23,200 |
| 2014 | $192 | $29,400 | $4,100 | $25,300 |
| 2013 | $192 | $31,600 | $4,100 | $27,500 |
Map
Source: Indiana Regional MLS
MLS Number: 201802678
APN: 09-17-56-477-044.000-010
Disclaimer: Certain information contained herein is derived from information provided by parties other than Homes.com. All information provided is deemed reliable, but is not guaranteed to be accurate and should be independently verified.
![]() IDX information is provided exclusively for personal, non-commercial use, and may not be used for any purpose other than to identify prospective properties consumers may be interested in purchasing. Information is deemed reliable but not guaranteed.
IDX information is provided exclusively for personal, non-commercial use, and may not be used for any purpose other than to identify prospective properties consumers may be interested in purchasing. Information is deemed reliable but not guaranteed.
- 108 N Cicott St
- 840 Helm St
- 900 W Wabash Ave
- 506 Howard St
- 514 W Linden Ave
- 320 W Clay St
- 80 Eel River Ave
- 408 Shultz St
- 115 Tanguy St
- 218 W Miami Ave
- 435 Washington St
- 204 Eel River Ave
- 203 Beal St
- 334 Burlington Ave
- 20 Wheatland Ave
- 408 Burlington Ave
- 825 West St
- 850 West St
- 426 Minor St
- 207 E Miami Ave