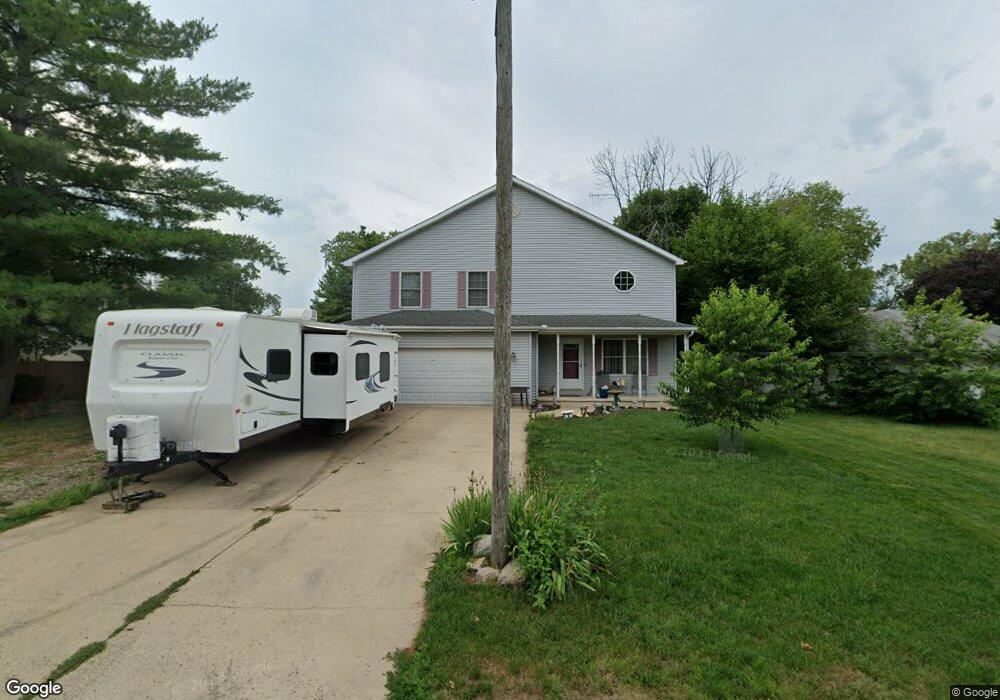
211 N Clinton St Mc Lean, IL 61754
Estimated Value: $203,000 - $287,811
Studio
--
Bath
1,572
Sq Ft
$158/Sq Ft
Est. Value
About This Home
This home is located at 211 N Clinton St, Mc Lean, IL 61754 and is currently estimated at $247,703, approximately $157 per square foot. 211 N Clinton St is a home located in McLean County with nearby schools including Olympia High School.
Ownership History
Date
Name
Owned For
Owner Type
Purchase Details
Closed on
Apr 29, 2013
Sold by
Ruestman Mark and Ruestman Karrie
Bought by
Heck William D
Current Estimated Value
Home Financials for this Owner
Home Financials are based on the most recent Mortgage that was taken out on this home.
Original Mortgage
$138,380
Interest Rate
3.75%
Mortgage Type
FHA
Purchase Details
Closed on
Jan 26, 2012
Sold by
Heck William and Heck Jessica
Bought by
Heck William and Heck Jessica
Home Financials for this Owner
Home Financials are based on the most recent Mortgage that was taken out on this home.
Original Mortgage
$152,218
Interest Rate
3.75%
Mortgage Type
FHA
Create a Home Valuation Report for This Property
The Home Valuation Report is an in-depth analysis detailing your home's value as well as a comparison with similar homes in the area
Purchase History
| Date | Buyer | Sale Price | Title Company |
|---|---|---|---|
| Heck William D | $170,000 | Frontier Title Co | |
| Heck William | -- | Attorney |
Source: Public Records
Mortgage History
| Date | Status | Borrower | Loan Amount |
|---|---|---|---|
| Previous Owner | Heck William D | $138,380 | |
| Previous Owner | Heck William | $152,218 |
Source: Public Records
Tax History
| Year | Tax Paid | Tax Assessment Tax Assessment Total Assessment is a certain percentage of the fair market value that is determined by local assessors to be the total taxable value of land and additions on the property. | Land | Improvement |
|---|---|---|---|---|
| 2024 | $5,942 | $81,845 | $3,880 | $77,965 |
| 2022 | $5,942 | $66,326 | $3,144 | $63,182 |
| 2021 | $5,563 | $62,460 | $2,961 | $59,499 |
| 2020 | $5,500 | $61,320 | $2,907 | $58,413 |
| 2019 | $5,469 | $61,320 | $2,907 | $58,413 |
| 2018 | $5,464 | $61,320 | $2,907 | $58,413 |
| 2017 | $5,498 | $61,320 | $2,907 | $58,413 |
| 2016 | $5,340 | $60,206 | $2,854 | $57,352 |
| 2015 | $4,930 | $58,288 | $2,763 | $55,525 |
| 2014 | $4,159 | $53,884 | $2,686 | $51,198 |
| 2013 | -- | $53,356 | $2,660 | $50,696 |
Source: Public Records
Map
Nearby Homes
- 113 N 2nd St
- 511 W Carlisle St
- 1517 W Lake Ct
- 46 N Lake Dr
- Lot 46 E Lake Ct
- 5 Sunnyside Estates
- 7 Sunnyside Estates
- 507 NW Race St
- 300 E South St
- 610 SE Vine St
- 3503 E 1000 North Rd
- 8428 N Shirlane St
- 106 W Boundary St
- 401 W Boundary St
- 407 W Boundary St
- 505 W North St
- 416 N Kathleen St
- 425 Jenny Ln Unit B
- LOT 63 and 78 Cobble Creek Ln
- 401 Jenny Ln
- 211 N Clinton St
- 213 N Clinton St
- 212 N Hamilton St
- 104 E Spencer St
- 100 E Spencer St
- 212 N Clinton St
- 200 E Spencer St
- 301 N Clinton St
- 200 E Charles St
- 100 E Charles St
- 213 N Hamilton St
- 100 W Spencer St
- 208 E Spencer St
- 105 E Spencer St
- 112 N Hamilton St
- 209 N East St
- 208 E Charles St
- 100 W Charles St
- 112 N Clinton St
- 209 E Spencer St
Your Personal Tour Guide
Ask me questions while you tour the home.