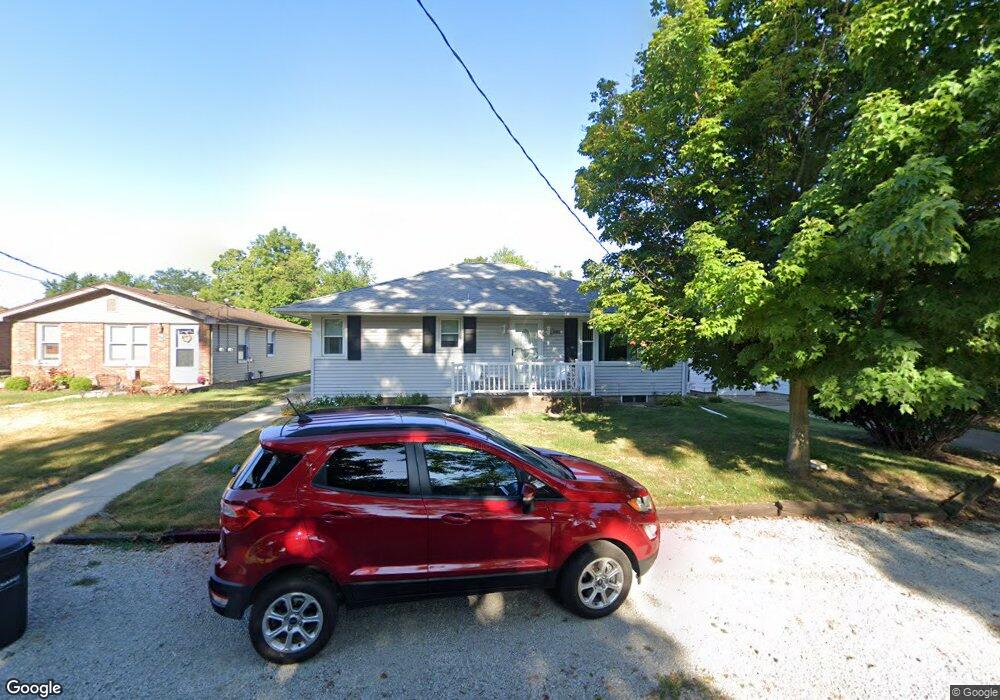
211 N Hanover St Unit 234 Metamora, IL 61548
Estimated Value: $155,458 - $193,000
--
Bed
--
Bath
1,181
Sq Ft
$147/Sq Ft
Est. Value
About This Home
This home is located at 211 N Hanover St Unit 234, Metamora, IL 61548 and is currently estimated at $173,365, approximately $146 per square foot. 211 N Hanover St Unit 234 is a home located in Woodford County with nearby schools including Metamora Grade School, Metamora High School, and St Mary's Catholic School.
Create a Home Valuation Report for This Property
The Home Valuation Report is an in-depth analysis detailing your home's value as well as a comparison with similar homes in the area
Home Values in the Area
Average Home Value in this Area
Tax History Compared to Growth
Tax History
| Year | Tax Paid | Tax Assessment Tax Assessment Total Assessment is a certain percentage of the fair market value that is determined by local assessors to be the total taxable value of land and additions on the property. | Land | Improvement |
|---|---|---|---|---|
| 2024 | $2,651 | $48,003 | $4,415 | $43,588 |
| 2023 | $2,646 | $44,133 | $4,059 | $40,074 |
| 2022 | $2,699 | $40,928 | $3,764 | $37,164 |
| 2021 | $2,698 | $40,316 | $3,708 | $36,608 |
| 2020 | $2,685 | $39,956 | $3,675 | $36,281 |
| 2019 | $2,681 | $41,276 | $3,796 | $37,480 |
| 2018 | $2,725 | $41,029 | $3,773 | $37,256 |
| 2017 | $2,711 | $41,029 | $3,773 | $37,256 |
| 2016 | $2,152 | $40,623 | $3,736 | $36,887 |
| 2015 | $340 | $39,363 | $3,620 | $35,743 |
| 2014 | $340 | $38,309 | $3,523 | $34,786 |
| 2013 | $340 | $38,583 | $3,548 | $35,035 |
Source: Public Records
Map
Nearby Homes
- 217 N Hanover St
- 203 W Partridge St
- 210 W Chatham St
- 348 Po Box
- 208 N Lafayette St
- 216 N Hanover St
- 202 W Chatham St
- 219 W Partridge St
- 216 N Lafayette St
- 212 N Hanover St
- 119 W Partridge St
- 220 N Hanover St
- 123 N Hanover St Unit 116
- 303 N Hanover St
- 121 W Chatham St
- 209 W Chatham St
- 116 W Partridge St
- 120 W Partridge St
- 303 W Partridge St
- 217 W Chatham St