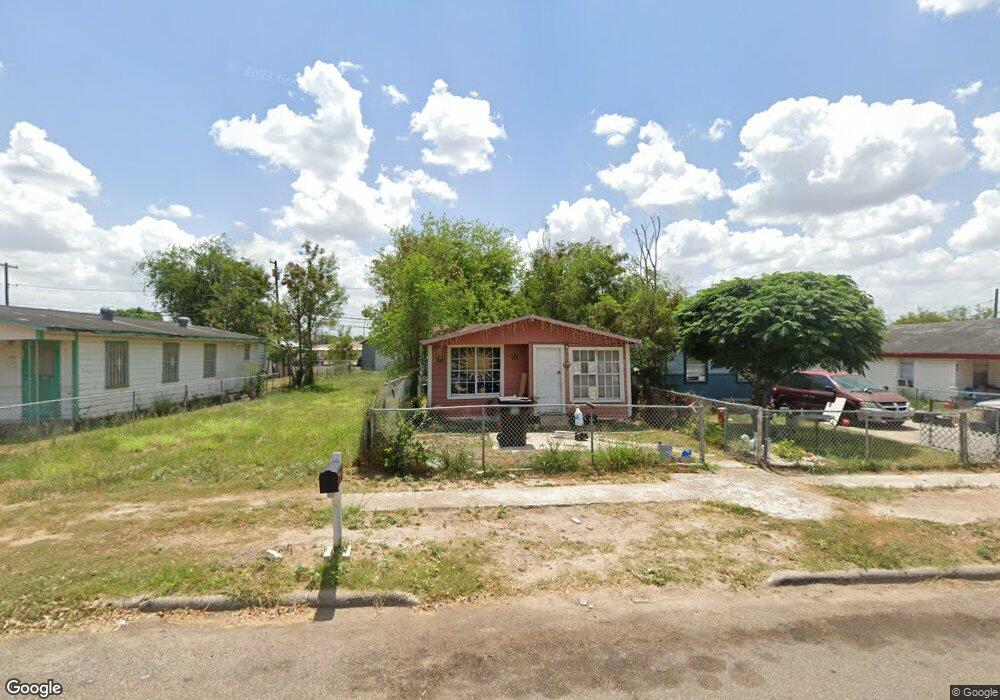
211 N Illinois Ave Weslaco, TX 78596
Estimated Value: $72,595 - $105,000
2
Beds
2
Baths
610
Sq Ft
$136/Sq Ft
Est. Value
About This Home
This home is located at 211 N Illinois Ave, Weslaco, TX 78596 and is currently estimated at $83,149, approximately $136 per square foot. 211 N Illinois Ave is a home located in Hidalgo County with nearby schools including Airport Elementary School, Armando Cuellar Middle School, and Weslaco East High School.
Ownership History
Date
Name
Owned For
Owner Type
Purchase Details
Closed on
Apr 8, 2011
Sold by
Baltazar Reyna and Esparza Reyna
Bought by
Olivo Edgardo and Mendez Elisa Marisol
Current Estimated Value
Home Financials for this Owner
Home Financials are based on the most recent Mortgage that was taken out on this home.
Original Mortgage
$18,000
Interest Rate
4.91%
Mortgage Type
Seller Take Back
Purchase Details
Closed on
Jun 1, 2007
Sold by
Elizondo Karina Limas De
Bought by
Mendez Jorge and Mendez Maria De Los Angeles
Home Financials for this Owner
Home Financials are based on the most recent Mortgage that was taken out on this home.
Original Mortgage
$27,100
Interest Rate
3.56%
Mortgage Type
Purchase Money Mortgage
Purchase Details
Closed on
Apr 3, 2006
Sold by
Rodriguez Limas Ciro and Rodriguez Ruiz Bertha
Bought by
Elizondo Karina Limas De
Create a Home Valuation Report for This Property
The Home Valuation Report is an in-depth analysis detailing your home's value as well as a comparison with similar homes in the area
Home Values in the Area
Average Home Value in this Area
Purchase History
| Date | Buyer | Sale Price | Title Company |
|---|---|---|---|
| Olivo Edgardo | -- | Sierra Title | |
| Mendez Jorge | -- | None Available | |
| Elizondo Karina Limas De | -- | None Available |
Source: Public Records
Mortgage History
| Date | Status | Borrower | Loan Amount |
|---|---|---|---|
| Previous Owner | Olivo Edgardo | $18,000 | |
| Previous Owner | Mendez Jorge | $27,100 |
Source: Public Records
Tax History Compared to Growth
Tax History
| Year | Tax Paid | Tax Assessment Tax Assessment Total Assessment is a certain percentage of the fair market value that is determined by local assessors to be the total taxable value of land and additions on the property. | Land | Improvement |
|---|---|---|---|---|
| 2025 | $1,180 | $49,156 | $24,219 | $24,937 |
| 2024 | $1,180 | $46,577 | $29,844 | $16,733 |
| 2023 | $1,177 | $46,577 | $29,844 | $16,733 |
| 2022 | $670 | $26,181 | $11,094 | $15,087 |
| 2021 | $609 | $23,432 | $11,094 | $12,338 |
| 2020 | $558 | $20,921 | $11,094 | $9,827 |
| 2019 | $488 | $17,896 | $10,469 | $7,427 |
| 2018 | $487 | $17,784 | $10,469 | $7,315 |
| 2017 | $485 | $17,784 | $10,469 | $7,315 |
| 2016 | $475 | $17,427 | $10,469 | $6,958 |
| 2015 | $534 | $17,427 | $10,469 | $6,958 |
Source: Public Records
Map
Nearby Homes
- 218 N Kansas Ave
- 118 N Kansas Ave
- 106 -108 S Kansas St
- 313 N Iowa Ave
- 133 N Missouri Ave
- 506 E Llano Grande St
- 504 E Agostadero St
- 100 S Cedro St
- 118 N Palmas St
- 311 E Los Torritos St
- 111 S Palmas St
- 216 Huisache St
- 515 E Huisache St
- 511 E Huisache St
- 206 S Palmas St
- 418 W Huisache St
- 2812 Alpha Rd
- 2905 Charlie Rd
- 2900 Delta Rd
- 2812 Delta Rd
- 207 N Illinois Ave
- 217 N Illinois Ave
- 201 N Illinois Ave
- 221 N Illinois Ave
- 210 N Kansas Ave
- 223 N Illinois Ave
- 216 N Kansas Ave
- 225 N Illinois Ave
- 210 N Illinois Ave
- 220 N Kansas Ave
- 214 N Illinois Ave
- 206 N Illinois Ave
- 119 N Illinois Ave
- 218 N Illinois Ave
- 202 N Illinois Ave
- 224 N Kansas Ave
- 222 N Illinois Ave
- 115 N Illinois Ave
- 226 N Illinois Ave
- 118 N Illinois Ave