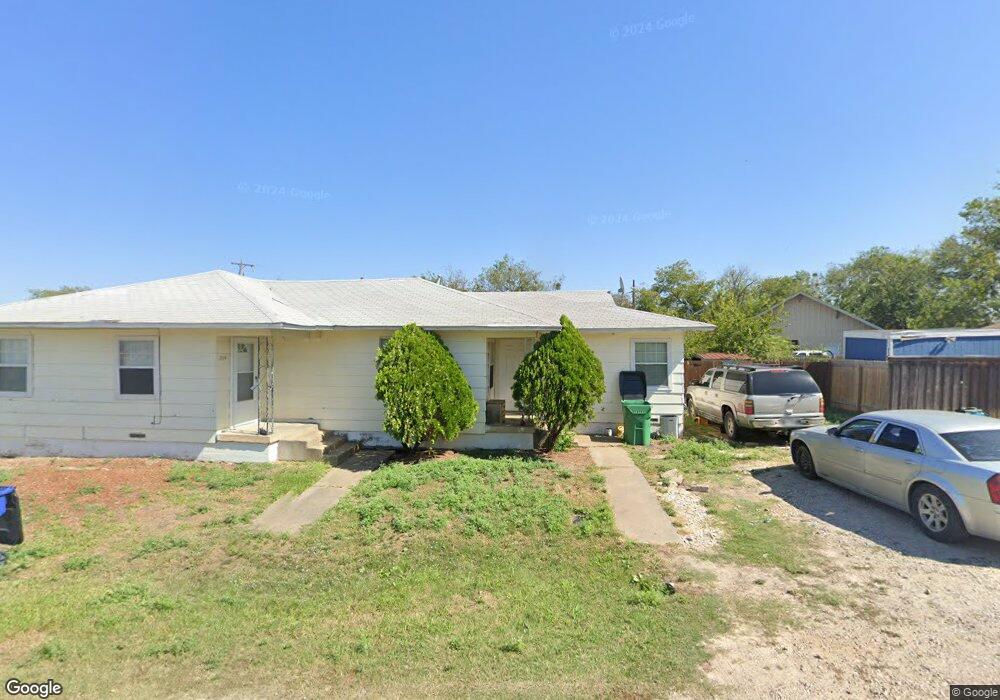
211 N Illinois St Unit A Celina, TX 75009
Estimated Value: $253,725 - $555,000
2
Beds
1
Bath
1,503
Sq Ft
$294/Sq Ft
Est. Value
About This Home
This home is located at 211 N Illinois St Unit A, Celina, TX 75009 and is currently estimated at $441,575, approximately $293 per square foot. 211 N Illinois St Unit A is a home located in Collin County with nearby schools including Celina Primary School, Moore Middle School, and Celina High School.
Ownership History
Date
Name
Owned For
Owner Type
Purchase Details
Closed on
Mar 10, 2023
Sold by
Patmore Charles Hanson
Bought by
Lonestar Taurus Holdings Llc
Current Estimated Value
Purchase Details
Closed on
Mar 24, 2022
Sold by
Grove Robert S
Bought by
Patmore Charles Hanson
Purchase Details
Closed on
Oct 31, 2005
Sold by
Tippie Tonya D
Bought by
Grove Robert S
Home Financials for this Owner
Home Financials are based on the most recent Mortgage that was taken out on this home.
Original Mortgage
$52,650
Interest Rate
8.15%
Mortgage Type
Fannie Mae Freddie Mac
Purchase Details
Closed on
Sep 3, 2002
Sold by
Wall Chris
Bought by
Tippie Tonya D
Purchase Details
Closed on
Sep 27, 1999
Sold by
Weems Michael D
Bought by
Lopez Wanda J
Create a Home Valuation Report for This Property
The Home Valuation Report is an in-depth analysis detailing your home's value as well as a comparison with similar homes in the area
Home Values in the Area
Average Home Value in this Area
Purchase History
| Date | Buyer | Sale Price | Title Company |
|---|---|---|---|
| Lonestar Taurus Holdings Llc | -- | Simplifile | |
| Patmore Charles Hanson | -- | Shaddock & Associates Pc | |
| Grove Robert S | -- | Fidelity National Title | |
| Tippie Tonya D | -- | -- | |
| Lopez Wanda J | -- | -- |
Source: Public Records
Mortgage History
| Date | Status | Borrower | Loan Amount |
|---|---|---|---|
| Previous Owner | Grove Robert S | $52,650 |
Source: Public Records
Tax History
| Year | Tax Paid | Tax Assessment Tax Assessment Total Assessment is a certain percentage of the fair market value that is determined by local assessors to be the total taxable value of land and additions on the property. | Land | Improvement |
|---|---|---|---|---|
| 2025 | $4,604 | $270,039 | $180,000 | $90,039 |
| 2024 | $5,198 | $251,781 | $150,000 | $101,781 |
| 2023 | $5,198 | $314,860 | $120,000 | $194,860 |
| 2022 | $5,323 | $232,233 | $78,000 | $191,090 |
| 2021 | $4,183 | $179,109 | $50,000 | $129,109 |
| 2020 | $2,495 | $101,827 | $20,000 | $81,827 |
| 2019 | $2,668 | $104,751 | $20,000 | $84,751 |
| 2018 | $2,764 | $108,086 | $20,000 | $88,086 |
| 2017 | $2,839 | $111,021 | $20,000 | $91,021 |
| 2016 | $1,592 | $61,821 | $8,000 | $53,821 |
| 2015 | $1,100 | $58,451 | $8,000 | $50,451 |
Source: Public Records
Map
Nearby Homes
- 212 N Arizona Dr
- 305 N Arizona Dr
- 311 N Illinois St
- 407 W Maple St
- 414 N Arizona Dr
- 336 Chestnut St
- 332 Chestnut St
- 324 Chestnut St
- 316 Chestnut St
- 317 Chestnut St
- 716 W Main St
- 300 Chestnut St
- 309 Chestnut St
- 220 Chestnut St
- 216 Chestnut St
- 309 S Arizona Dr
- Lot 2 Louisiana
- Lot 1 Louisiana
- 101 Chestnut St
- 212 E Walnut St
- 211 N Illinois St
- 506 W Beech St
- 210 N Illinois St
- 509 W Pecan St
- 208 N Arizona Dr
- 503 W Pecan St
- 308 N Illinois St
- 302 N Arizona Dr
- 610 W Beech St
- 610 W Beech St Unit 1
- 603 W Pecan St
- 501 W Pecan St
- TBD N Arizona Dr
- 607 W Beech St
- 303 N Arizona Dr
- 307 N Arizona Dr
- 412 W Beech St
- 310 N Arizona Dr
- 512 W Maple St
- 508 W Maple St
Your Personal Tour Guide
Ask me questions while you tour the home.