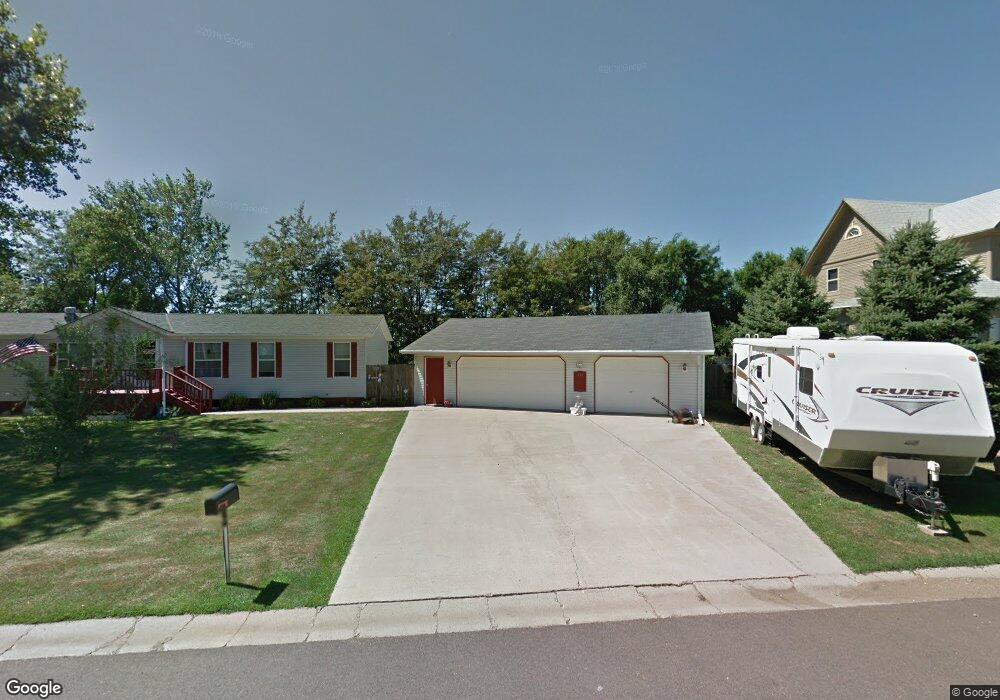
211 N Kemper St Viborg, SD 57070
Estimated Value: $170,000 - $260,000
3
Beds
3
Baths
1,848
Sq Ft
$117/Sq Ft
Est. Value
About This Home
This home is located at 211 N Kemper St, Viborg, SD 57070 and is currently estimated at $215,897, approximately $116 per square foot. 211 N Kemper St is a home located in Turner County with nearby schools including Viborg-Hurley Elementary School, Cameron Colony Elementary School, and Viborg-Hurley Middle School.
Ownership History
Date
Name
Owned For
Owner Type
Purchase Details
Closed on
Oct 31, 2011
Sold by
Spence Jeff and Spence Norma
Bought by
Clifford Donald R and Clifford Carolyn S
Current Estimated Value
Create a Home Valuation Report for This Property
The Home Valuation Report is an in-depth analysis detailing your home's value as well as a comparison with similar homes in the area
Home Values in the Area
Average Home Value in this Area
Purchase History
| Date | Buyer | Sale Price | Title Company |
|---|---|---|---|
| Clifford Donald R | -- | -- |
Source: Public Records
Mortgage History
| Date | Status | Borrower | Loan Amount |
|---|---|---|---|
| Closed | Clifford Donald R | $0 |
Source: Public Records
Tax History Compared to Growth
Tax History
| Year | Tax Paid | Tax Assessment Tax Assessment Total Assessment is a certain percentage of the fair market value that is determined by local assessors to be the total taxable value of land and additions on the property. | Land | Improvement |
|---|---|---|---|---|
| 2025 | $3,019 | $191,383 | $23,819 | $167,564 |
| 2024 | $2,908 | $191,383 | $23,819 | $167,564 |
| 2023 | $2,501 | $191,383 | $23,819 | $167,564 |
| 2022 | $2,168 | $167,880 | $20,894 | $146,986 |
| 2021 | $2,156 | $129,138 | $16,072 | $113,066 |
| 2020 | $2,056 | $129,138 | $16,072 | $113,066 |
| 2019 | $2,032 | $118,475 | $14,745 | $103,730 |
| 2018 | $1,629 | $115,025 | $14,315 | $100,710 |
| 2017 | $1,490 | $85,345 | $9,605 | $75,740 |
| 2016 | $137 | $74,210 | $8,350 | $65,860 |
| 2015 | $137 | $61,845 | $6,960 | $54,885 |
| 2012 | -- | $85,895 | $9,665 | $76,230 |
Source: Public Records
Map
Nearby Homes
- 0 Lot 5 Blk 2 Valhalla Dr
- 0 Lot 12 Blk 2 Kemper St
- 0 Lot 2a Blk 4 Valhalla Dr
- 0 Dr
- 0 Lot 3 Blk 2 - Valhalla Dr
- 500 W Lincoln Ave
- 0 Lot 1a Blk 3 Viking Ave Unit 22505652
- 0 N Elmwood St Unit 22507122
- 210 S Clark
- 511 E Park Ave
- 0 455th Ave
- 0 290th St Unit 22201045
- 293rd
- 100 Bright Shores Dr Dr
- 293rd and 452nd
- 45117 292nd St
- 29666 453rd Ave
- 44904 289th St
- 45390 284th St
- 1221 Vermillion St
- 211 Kemper St
- 213 N Kemper St
- 0 Lot 6 Blk 2 Valhalla Dr
- 209 N Kemper St
- 0 Lot 7 Blk 2 Valhalla Dr
- 212 N Kemper St
- 0 Lot 8 Blk 2 Valhalla Dr
- 202 N Kemper St
- 0 Lot 9 Blk 2 Valhalla Dr
- 0 Lot 5 Blk 4 Valhalla Dr
- 200 N Kemper St
- 205 N Kemper St
- 217 N Kemper St
- 0 Lot 6 Blk 4 Valhalla Dr
- 0 Lot 10 Blk 2 Valhalla Dr
- 309 N Maple St
- 307 N Maple St
- 0 Lot 7 Blk 4 Valhalla Dr
- 0 Kemper St
- 313 N Maple St