Estimated Value: $111,000 - $163,000
3
Beds
2
Baths
2,225
Sq Ft
$62/Sq Ft
Est. Value
About This Home
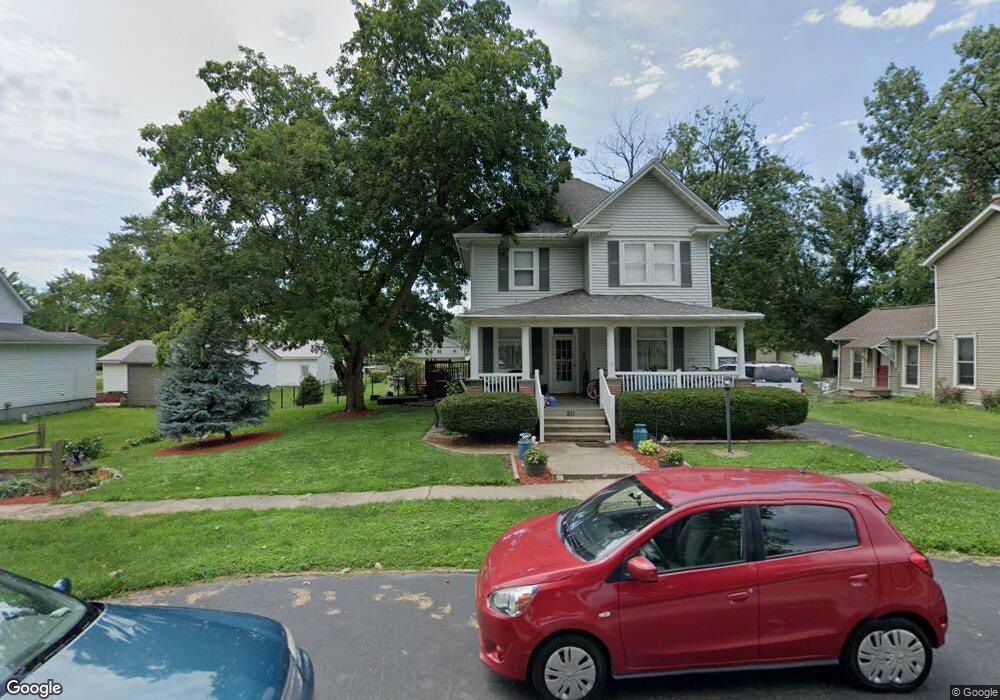
This home is located at 211 N Locust St, Maroa, IL 61756 and is currently estimated at $138,836, approximately $62 per square foot. 211 N Locust St is a home located in Macon County with nearby schools including Maroa-Forsyth Grade School, Maroa-Forsyth Middle School, and Maroa-Forsyth Senior High School.
Ownership History
Date
Name
Owned For
Owner Type
Purchase Details
Closed on
Feb 16, 2013
Sold by
Beller Amy
Bought by
Goede Adrian and Goede Melissa
Current Estimated Value
Home Financials for this Owner
Home Financials are based on the most recent Mortgage that was taken out on this home.
Original Mortgage
$64,781
Outstanding Balance
$45,223
Interest Rate
3.38%
Mortgage Type
New Conventional
Estimated Equity
$93,613
Purchase Details
Closed on
Apr 11, 2011
Sold by
Beller Thomas W
Bought by
Beller Amy M
Purchase Details
Closed on
Apr 13, 2009
Sold by
Eppolito Dorninie A and Eppolito Tammie L
Bought by
Beller Thomas and Beller Amy
Home Financials for this Owner
Home Financials are based on the most recent Mortgage that was taken out on this home.
Original Mortgage
$62,400
Interest Rate
5.19%
Mortgage Type
Adjustable Rate Mortgage/ARM
Purchase Details
Closed on
Oct 1, 2004
Create a Home Valuation Report for This Property
The Home Valuation Report is an in-depth analysis detailing your home's value as well as a comparison with similar homes in the area
Home Values in the Area
Average Home Value in this Area
Purchase History
| Date | Buyer | Sale Price | Title Company |
|---|---|---|---|
| Goede Adrian | $58,500 | None Available | |
| Beller Amy M | -- | None Available | |
| Beller Thomas | $78,000 | None Available | |
| -- | $83,000 | -- |
Source: Public Records
Mortgage History
| Date | Status | Borrower | Loan Amount |
|---|---|---|---|
| Open | Goede Adrian | $64,781 | |
| Previous Owner | Beller Thomas | $62,400 |
Source: Public Records
Tax History Compared to Growth
Tax History
| Year | Tax Paid | Tax Assessment Tax Assessment Total Assessment is a certain percentage of the fair market value that is determined by local assessors to be the total taxable value of land and additions on the property. | Land | Improvement |
|---|---|---|---|---|
| 2024 | $3,765 | $41,234 | $4,251 | $36,983 |
| 2023 | $3,553 | $38,314 | $3,950 | $34,364 |
| 2022 | $3,367 | $36,141 | $3,726 | $32,415 |
| 2021 | $3,261 | $34,330 | $3,540 | $30,790 |
| 2020 | $2,989 | $32,351 | $3,336 | $29,015 |
| 2019 | $2,989 | $32,351 | $3,336 | $29,015 |
| 2018 | $2,858 | $31,584 | $3,257 | $28,327 |
| 2017 | $2,965 | $31,460 | $3,271 | $28,189 |
| 2016 | $2,959 | $31,422 | $3,267 | $28,155 |
| 2015 | $2,797 | $30,507 | $3,172 | $27,335 |
| 2014 | $2,708 | $30,205 | $3,141 | $27,064 |
| 2013 | $2,734 | $30,205 | $3,141 | $27,064 |
Source: Public Records
Map
Nearby Homes
- 218 N Maple St
- 116 S Maple St
- 303 W Main St
- 424 E Kennedy St
- 309 N Linden St
- 14479 N Oakland Ave
- 2480 Lillian
- 2440 Lillian
- 2420 Lillian Unit 23
- 2460 Lillian
- 2490 Lillian
- 0 Betty Ln Unit 10514801
- 157 Shadow Ridge Blvd
- 21 Colonial Dr
- 120 Shadow Ridge Blvd
- 335 Loma Dr
- 3 Delmar Dr
- 355 S Smith St
- 701 S Cain St
- 0 W Elm St
- 429 E Washington St
- 217 N Locust St
- 221 N Locust St
- 503 E Washington St
- 220 N Oak St
- 212 N Locust St
- 229 N Locust St
- 133 N Locust St
- 218 N Locust St
- 416 E Jackson St
- 502 E Washington St
- 403 E Washington St
- 428 E Jackson St
- 410 E Washington St
- 509 E Washington St
- 228 N Locust St
- 400 E Washington St
- 230 N Locust St
- 521 E Washington St
- 404 E Jackson St