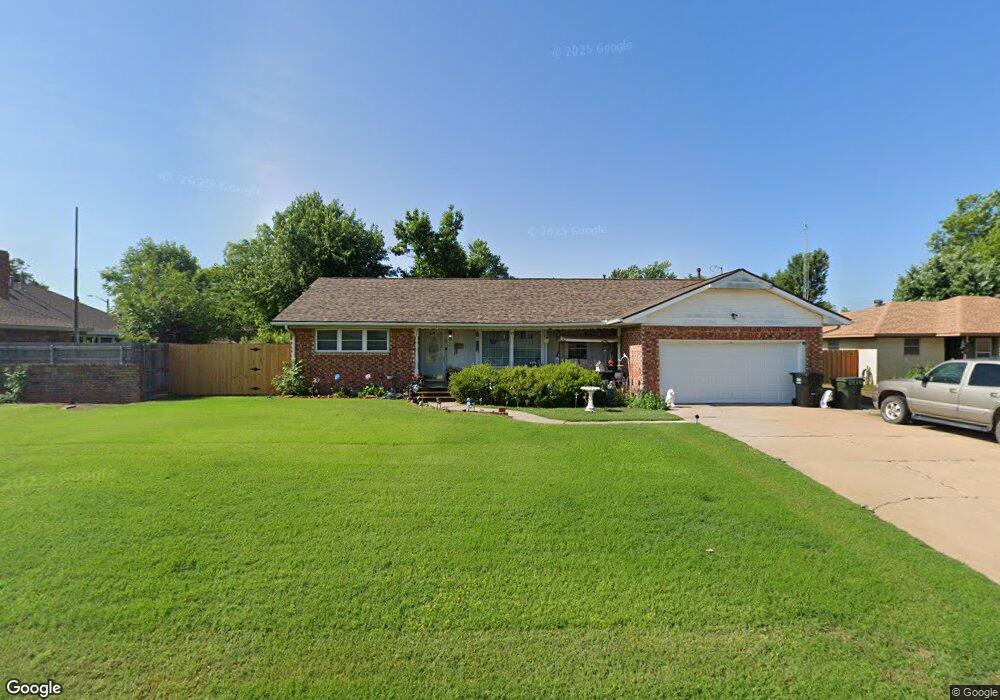
211 Norwood Ct Watonga, OK 73772
Estimated Value: $103,000 - $139,000
3
Beds
2
Baths
1,611
Sq Ft
$78/Sq Ft
Est. Value
About This Home
This home is located at 211 Norwood Ct, Watonga, OK 73772 and is currently estimated at $125,937, approximately $78 per square foot. 211 Norwood Ct is a home located in Blaine County with nearby schools including Watonga Elementary School, Watonga Middle School, and Watonga High School.
Ownership History
Date
Name
Owned For
Owner Type
Purchase Details
Closed on
Feb 24, 2012
Sold by
Johnson Jimmy and Johnson Doris
Bought by
Johnson Jimmy and Johnson Doris
Current Estimated Value
Purchase Details
Closed on
Jun 6, 2008
Sold by
Mccormack William and Mccormack Deloris
Bought by
Secretary Of Hud
Purchase Details
Closed on
Jul 12, 2005
Sold by
Nitzel Michael T and Nitzel Tatum L
Bought by
Mccormack William
Home Financials for this Owner
Home Financials are based on the most recent Mortgage that was taken out on this home.
Original Mortgage
$73,841
Interest Rate
5.64%
Mortgage Type
FHA
Purchase Details
Closed on
Nov 18, 2002
Sold by
Dennis Ricky and Dennis Marva D
Bought by
Nitzel Michael and Nitzel Tatum
Purchase Details
Closed on
Oct 7, 1999
Sold by
Pinterton Daisie
Bought by
Dennis Ricky and Dennis Marva D
Create a Home Valuation Report for This Property
The Home Valuation Report is an in-depth analysis detailing your home's value as well as a comparison with similar homes in the area
Home Values in the Area
Average Home Value in this Area
Purchase History
| Date | Buyer | Sale Price | Title Company |
|---|---|---|---|
| Johnson Jimmy | -- | None Available | |
| Secretary Of Hud | $72,921 | -- | |
| Mccormack William | $75,000 | None Available | |
| Nitzel Michael | $65,500 | -- | |
| Dennis Ricky | $55,000 | -- |
Source: Public Records
Mortgage History
| Date | Status | Borrower | Loan Amount |
|---|---|---|---|
| Previous Owner | Mccormack William | $73,841 |
Source: Public Records
Tax History Compared to Growth
Tax History
| Year | Tax Paid | Tax Assessment Tax Assessment Total Assessment is a certain percentage of the fair market value that is determined by local assessors to be the total taxable value of land and additions on the property. | Land | Improvement |
|---|---|---|---|---|
| 2024 | $724 | $8,450 | $1,081 | $7,369 |
| 2023 | $701 | $8,204 | $1,081 | $7,123 |
| 2022 | $757 | $7,965 | $1,081 | $6,884 |
| 2021 | $685 | $7,965 | $1,081 | $6,884 |
| 2020 | $680 | $7,995 | $1,081 | $6,914 |
| 2019 | $707 | $8,123 | $1,081 | $7,042 |
| 2018 | $792 | $8,646 | $1,303 | $7,343 |
| 2017 | $815 | $8,650 | $858 | $7,792 |
| 2016 | $862 | $8,617 | $858 | $7,759 |
| 2015 | $789 | $8,825 | $858 | $7,967 |
| 2014 | $614 | $8,633 | $858 | $7,775 |
Source: Public Records
Map
Nearby Homes
- 1017 N Prouty Ave
- 524 Skyview Dr
- 501 Northampton Dr
- 518 Sunset Dr
- 1100 N Weigle Ave
- 815 N Prouty Ave
- 704 N Prouty Ave
- 900 N Burford Ave
- 834 Mimosa Dr
- 101 E 5th St Unit 103 E 5th St
- 710 N Forrest Ave
- 711 Villa Place Unit 181A
- 515 N Burford Ave
- 401 N Leach Ave
- 100 W 3rd St
- 319 N Wikoff Ave
- 409 W 3rd St
- 416 N Burford Ave
- 411 N Forrest Ave
- 617 W 3rd St