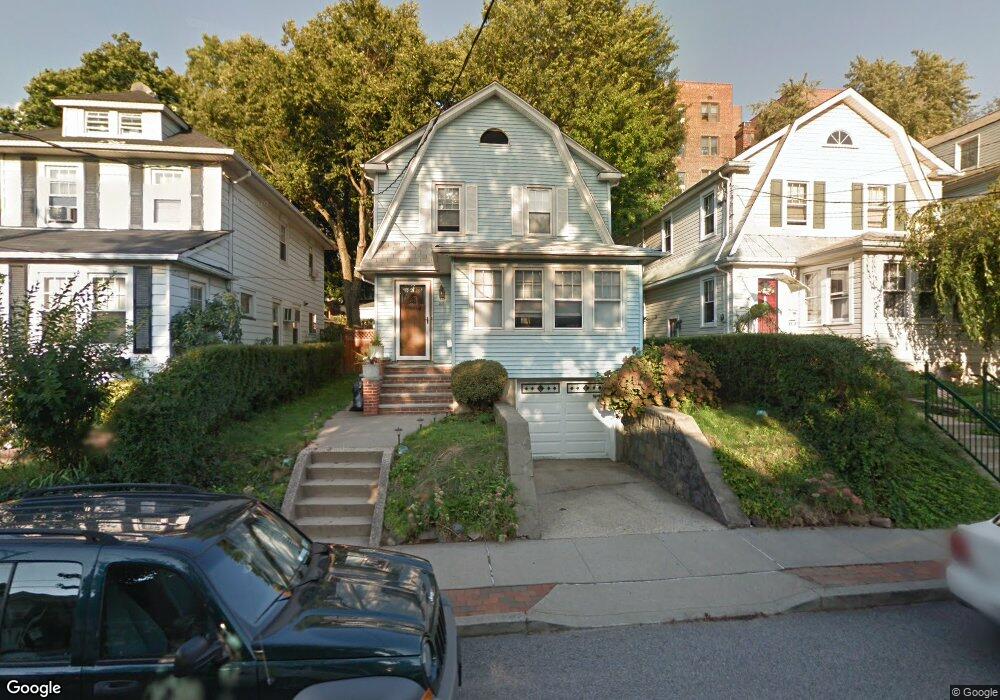
211 Oakwood Ave Staten Island, NY 10301
Silver Lake NeighborhoodEstimated Value: $694,776 - $848,000
3
Beds
1
Bath
1,500
Sq Ft
$519/Sq Ft
Est. Value
About This Home
This home is located at 211 Oakwood Ave, Staten Island, NY 10301 and is currently estimated at $778,694, approximately $519 per square foot. 211 Oakwood Ave is a home located in Richmond County with nearby schools including P.S. 45 John Tyler, Is 61 William A Morris, and Curtis High School.
Ownership History
Date
Name
Owned For
Owner Type
Purchase Details
Closed on
Sep 13, 1999
Sold by
Osullivan Elizabeth Colleen
Bought by
Curry Frank Louis and Curry Thea Jon
Current Estimated Value
Home Financials for this Owner
Home Financials are based on the most recent Mortgage that was taken out on this home.
Original Mortgage
$160,000
Interest Rate
7.81%
Purchase Details
Closed on
Feb 9, 1999
Sold by
Osullivan Donal
Bought by
Osullivan Elizabeth Colleen
Purchase Details
Closed on
Jan 28, 1996
Sold by
Hanlon Maureen and Osullivan Elizabeth Colleen
Bought by
Sullivan Donal and Osullivan Elizabeth Colleen
Home Financials for this Owner
Home Financials are based on the most recent Mortgage that was taken out on this home.
Original Mortgage
$76,650
Interest Rate
8.21%
Create a Home Valuation Report for This Property
The Home Valuation Report is an in-depth analysis detailing your home's value as well as a comparison with similar homes in the area
Home Values in the Area
Average Home Value in this Area
Purchase History
| Date | Buyer | Sale Price | Title Company |
|---|---|---|---|
| Curry Frank Louis | $180,000 | Fidelity National Title Ins | |
| Osullivan Elizabeth Colleen | -- | Title Insurance Of Ny Inc | |
| Sullivan Donal | -- | Ticor Title Guarantee Compan |
Source: Public Records
Mortgage History
| Date | Status | Borrower | Loan Amount |
|---|---|---|---|
| Previous Owner | Curry Frank Louis | $160,000 | |
| Previous Owner | Sullivan Donal | $76,650 |
Source: Public Records
Tax History Compared to Growth
Tax History
| Year | Tax Paid | Tax Assessment Tax Assessment Total Assessment is a certain percentage of the fair market value that is determined by local assessors to be the total taxable value of land and additions on the property. | Land | Improvement |
|---|---|---|---|---|
| 2025 | $6,717 | $40,260 | $12,350 | $27,910 |
| 2024 | $6,729 | $42,600 | $11,581 | $31,019 |
| 2023 | $6,392 | $32,872 | $11,425 | $21,447 |
| 2022 | $5,904 | $40,680 | $14,160 | $26,520 |
| 2021 | $5,855 | $37,440 | $14,160 | $23,280 |
| 2020 | $5,898 | $35,700 | $14,160 | $21,540 |
| 2019 | $5,781 | $35,460 | $14,160 | $21,300 |
| 2018 | $5,286 | $27,393 | $10,847 | $16,546 |
| 2017 | $4,969 | $25,845 | $11,662 | $14,183 |
| 2016 | $4,565 | $24,384 | $13,321 | $11,063 |
| 2015 | $4,338 | $24,384 | $14,754 | $9,630 |
| 2014 | $4,338 | $24,196 | $14,640 | $9,556 |
Source: Public Records
Map
Nearby Homes
- 215 Hart Blvd Unit 3L
- 58-62 University Place
- 72 Gregg Place
- 372 Sharon Ave
- 112 Delafield Ave
- 54 City Blvd
- 776 Brighton Ave
- 171 Silver Lake Rd
- 525 Castleton Ave Unit 1C
- 414 Castleton Ave
- 20 Baker Place
- 26 Valencia Ave
- 585 Castleton Ave Unit 1c
- 244 Delafield Ave
- 435 Castleton Ave
- 34 Harvest Ave
- 328 Stanley Ave
- 354 Hoyt Ave
- 100 Lawrence Ave
- 1 Sunset Hill Dr
- 207 Oakwood Ave
- 213 Oakwood Ave
- 205 Oakwood Ave
- 217 Oakwood Ave
- 203 Oakwood Ave
- 192 Hart Blvd
- 190 Hart Blvd
- 219 Oakwood Ave
- 352 Forest Ave
- 184 Hart Blvd
- 200 Hart Blvd Unit 6H
- 200 Hart Blvd Unit 6G
- 200 Hart Blvd Unit 6F
- 200 Hart Blvd Unit 6E
- 200 Hart Blvd Unit 6D
- 200 Hart Blvd Unit 6B
- 200 Hart Blvd Unit 6A
- 200 Hart Blvd Unit 5H
- 200 Hart Blvd Unit 5G
- 200 Hart Blvd Unit 5F