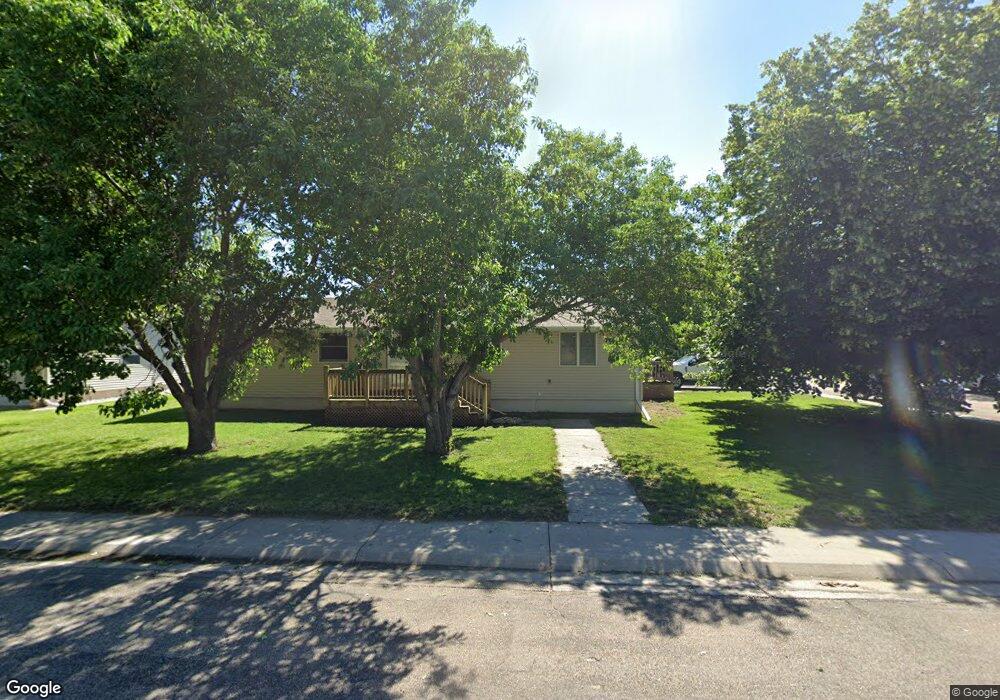
211 S 8th St Battle Creek, NE 68715
Estimated Value: $257,000 - $320,000
3
Beds
2
Baths
1,376
Sq Ft
$208/Sq Ft
Est. Value
About This Home
This home is located at 211 S 8th St, Battle Creek, NE 68715 and is currently estimated at $286,084, approximately $207 per square foot. 211 S 8th St is a home located in Madison County with nearby schools including Battle Creek Elementary School and Battle Creek High School.
Ownership History
Date
Name
Owned For
Owner Type
Purchase Details
Closed on
Nov 27, 2023
Sold by
Pentagon Investments Llc
Bought by
Tiedtke Christopher G
Current Estimated Value
Home Financials for this Owner
Home Financials are based on the most recent Mortgage that was taken out on this home.
Original Mortgage
$247,782
Outstanding Balance
$239,263
Interest Rate
4%
Mortgage Type
Seller Take Back
Estimated Equity
$46,821
Purchase Details
Closed on
Jun 12, 2019
Sold by
Praeuner Allan
Bought by
Neidig Justin B
Home Financials for this Owner
Home Financials are based on the most recent Mortgage that was taken out on this home.
Original Mortgage
$155,000
Interest Rate
4.1%
Mortgage Type
Seller Take Back
Purchase Details
Closed on
Mar 15, 2018
Sold by
Throckmorton Kim I
Bought by
Neidig Bryce P and Neidig Shirley A
Purchase Details
Closed on
Nov 1, 2012
Sold by
Gillespie Daniel and Gillespie Daniel J
Bought by
Gillespie Vickie and Gillespie Victoria A
Purchase Details
Closed on
Apr 5, 2010
Sold by
Finley Wade S and Finley Lynette K
Bought by
Gillespie Daniel and Gillespie Vickie
Purchase Details
Closed on
Jun 22, 2001
Sold by
Reifenrath Gary D and Reifenrath Joanne M
Bought by
Finley Wade S and Finley Lynette K
Create a Home Valuation Report for This Property
The Home Valuation Report is an in-depth analysis detailing your home's value as well as a comparison with similar homes in the area
Home Values in the Area
Average Home Value in this Area
Purchase History
| Date | Buyer | Sale Price | Title Company |
|---|---|---|---|
| Tiedtke Christopher G | $263,000 | Tri County Title | |
| Neidig Justin B | $160,000 | None Available | |
| Neidig Bryce P | -- | None Available | |
| Gillespie Vickie | -- | None Available | |
| Gillespie Daniel | $152,000 | None Available | |
| Finley Wade S | $84,000 | -- |
Source: Public Records
Mortgage History
| Date | Status | Borrower | Loan Amount |
|---|---|---|---|
| Open | Tiedtke Christopher G | $247,782 | |
| Previous Owner | Neidig Justin B | $155,000 |
Source: Public Records
Tax History Compared to Growth
Tax History
| Year | Tax Paid | Tax Assessment Tax Assessment Total Assessment is a certain percentage of the fair market value that is determined by local assessors to be the total taxable value of land and additions on the property. | Land | Improvement |
|---|---|---|---|---|
| 2024 | $2,654 | $210,317 | $15,938 | $194,379 |
| 2023 | $3,606 | $201,583 | $15,938 | $185,645 |
| 2022 | $3,397 | $189,924 | $15,938 | $173,986 |
| 2021 | $2,884 | $165,029 | $15,938 | $149,091 |
| 2020 | $2,649 | $152,719 | $15,938 | $136,781 |
| 2019 | $2,636 | $152,719 | $15,938 | $136,781 |
| 2018 | $2,321 | $141,104 | $15,938 | $125,166 |
| 2017 | $2,227 | $133,910 | $15,194 | $118,716 |
| 2016 | $2,186 | $126,605 | $15,194 | $111,411 |
| 2015 | $2,170 | $126,605 | $15,194 | $111,411 |
| 2014 | $2,097 | $115,539 | $13,813 | $101,726 |
| 2013 | $2,373 | $115,539 | $13,813 | $101,726 |
Source: Public Records
Map
Nearby Homes
- 202 Highland Dr
- 101 N 4th St
- 103 N 4th St
- 303 S Boyer St
- 304 E Herman St
- 401 E Hale St
- 000 836th 1 2 Rd
- 834th Rd 542nd Ave
- 0 See Legal Unit 250827
- 5105 W Sherwood Rd
- SEE Legal
- 84529 542 Ave
- 856 S 4th St
- 854 4th St
- 4801 N Deer Run Dr
- 84453 539th Ave
- 3900 Madison Ave
- 3507 Bradford Ave
- 3506 Bradford Ave
- 3407 Bradford Ave