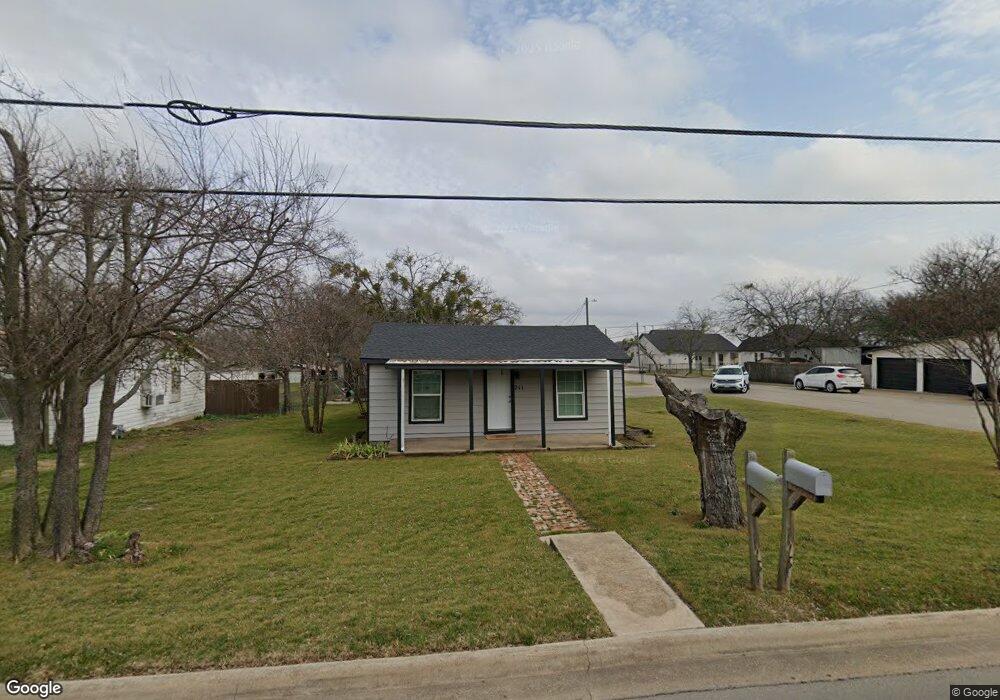
211 S Bowie Dr Weatherford, TX 76086
Estimated Value: $235,000 - $306,000
--
Bed
--
Bath
1,634
Sq Ft
$161/Sq Ft
Est. Value
About This Home
This home is located at 211 S Bowie Dr, Weatherford, TX 76086 and is currently estimated at $263,667, approximately $161 per square foot. 211 S Bowie Dr is a home located in Parker County with nearby schools including Curtis Elementary School, Hall Middle School, and Weatherford High School.
Ownership History
Date
Name
Owned For
Owner Type
Purchase Details
Closed on
Aug 26, 2022
Sold by
Semper Ama Llc
Bought by
Semper Ama Llc-Series I and Semper Ama Llc
Current Estimated Value
Purchase Details
Closed on
Apr 9, 2021
Sold by
Mccoy Robert G and Mccoy Donna A
Bought by
Semper Ama Llc
Home Financials for this Owner
Home Financials are based on the most recent Mortgage that was taken out on this home.
Original Mortgage
$152,000
Interest Rate
2.9%
Mortgage Type
New Conventional
Purchase Details
Closed on
Nov 1, 1999
Sold by
Burgess Philip
Bought by
Mccoy Robert G and Mccoy Donna A
Purchase Details
Closed on
Feb 29, 1996
Bought by
Mccoy Robert G and Mccoy Donna A
Purchase Details
Closed on
Jun 13, 1983
Bought by
Mccoy Robert G and Mccoy Donna A
Create a Home Valuation Report for This Property
The Home Valuation Report is an in-depth analysis detailing your home's value as well as a comparison with similar homes in the area
Home Values in the Area
Average Home Value in this Area
Purchase History
| Date | Buyer | Sale Price | Title Company |
|---|---|---|---|
| Semper Ama Llc-Series I | -- | Tyler A Harden Attorney Pc | |
| Semper Ama Llc | -- | None Listed On Document | |
| Mccoy Robert G | -- | -- | |
| Mccoy Robert G | -- | -- | |
| Mccoy Robert G | -- | -- |
Source: Public Records
Mortgage History
| Date | Status | Borrower | Loan Amount |
|---|---|---|---|
| Previous Owner | Semper Ama Llc | $152,000 |
Source: Public Records
Tax History Compared to Growth
Tax History
| Year | Tax Paid | Tax Assessment Tax Assessment Total Assessment is a certain percentage of the fair market value that is determined by local assessors to be the total taxable value of land and additions on the property. | Land | Improvement |
|---|---|---|---|---|
| 2025 | $5,135 | $268,320 | $50,000 | $218,320 |
| 2024 | $5,135 | $266,410 | $40,000 | $226,410 |
| 2023 | $5,135 | $266,410 | $40,000 | $226,410 |
| 2022 | $2,211 | $99,660 | $15,000 | $84,660 |
| 2021 | $2,393 | $99,660 | $15,000 | $84,660 |
| 2020 | $2,572 | $106,450 | $15,000 | $91,450 |
| 2019 | $2,718 | $106,450 | $15,000 | $91,450 |
| 2018 | $2,387 | $93,060 | $15,000 | $78,060 |
| 2017 | $2,449 | $93,060 | $15,000 | $78,060 |
| 2016 | $2,133 | $81,070 | $15,000 | $66,070 |
| 2015 | $2,089 | $81,070 | $15,000 | $66,070 |
| 2014 | $1,987 | $79,130 | $15,000 | $64,130 |
Source: Public Records
Map
Nearby Homes
- 1105 Palo Pinto St
- 1221 Elmira St
- 1113 Keechi St
- 1012 Keechi St
- 220 S Merrimac
- 115 Harmon St
- 302 Case St
- 217 Clinton Dr
- 145 Redbud Ln
- 616 W Baylor St
- 313 N Dubellette St
- 1007 W Water St
- 314 N Dubellette St
- 905 W Oak St
- 819 Norton St
- 702 W Spring St
- 606 Palo Pinto St
- 213 Jefferson St
- 221 Jefferson St
- 208 Jefferson St
- 209 S Bowie Dr
- 301 S Bowie Dr
- 1104 W Bishop St
- 303 S Bowie Dr
- 208 S Bowie Dr
- 206 S Bowie Dr
- 302 S Bowie Dr
- 304 S Bowie Dr
- 1101 W Oak St
- 311 S Bowie Dr
- 1106 Cherokee St
- 207 Love St
- 207 Love St Unit 110
- 207 Love St Unit 109
- 207 Love St Unit 112
- 1104 Cherokee St
- 205 Love St Unit 107
- 205 Love St Unit 101
- 205 Love St Unit 106
- 205 Love St