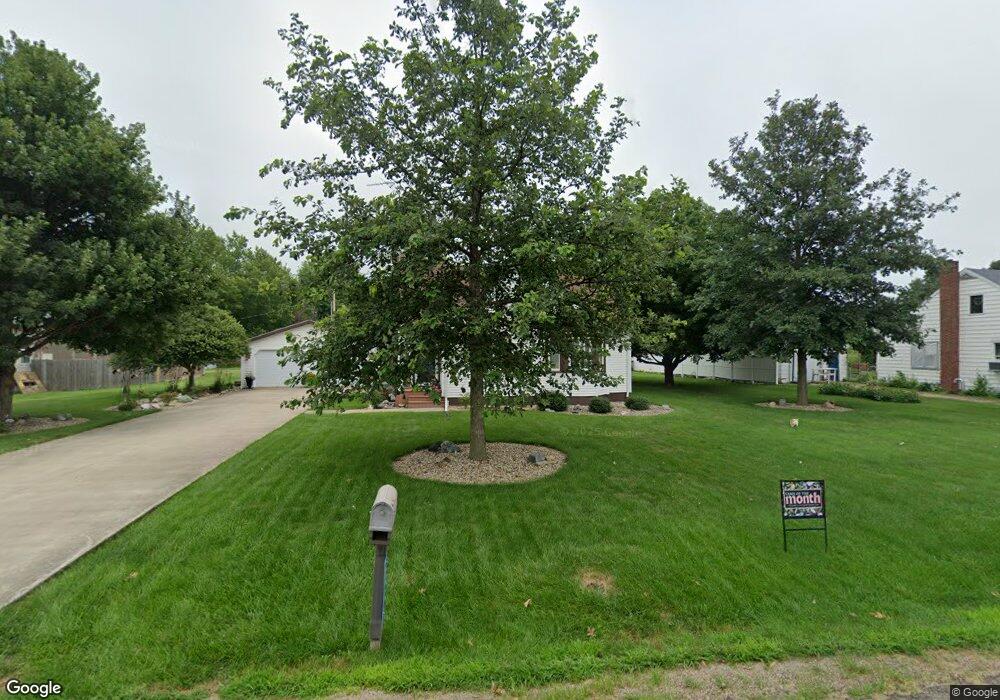
211 S Logan St Stronghurst, IL 61480
Estimated Value: $99,000 - $123,000
2
Beds
--
Bath
1,385
Sq Ft
$80/Sq Ft
Est. Value
About This Home
This home is located at 211 S Logan St, Stronghurst, IL 61480 and is currently estimated at $111,180, approximately $80 per square foot. 211 S Logan St is a home with nearby schools including West Central Elementary School and West Central High School.
Ownership History
Date
Name
Owned For
Owner Type
Purchase Details
Closed on
Jul 8, 1991
Bought by
Annegers Sharon A
Current Estimated Value
Create a Home Valuation Report for This Property
The Home Valuation Report is an in-depth analysis detailing your home's value as well as a comparison with similar homes in the area
Home Values in the Area
Average Home Value in this Area
Purchase History
| Date | Buyer | Sale Price | Title Company |
|---|---|---|---|
| Annegers Sharon A | -- | -- |
Source: Public Records
Tax History Compared to Growth
Tax History
| Year | Tax Paid | Tax Assessment Tax Assessment Total Assessment is a certain percentage of the fair market value that is determined by local assessors to be the total taxable value of land and additions on the property. | Land | Improvement |
|---|---|---|---|---|
| 2024 | $1,586 | $29,606 | $4,286 | $25,320 |
| 2023 | $1,504 | $27,713 | $4,012 | $23,701 |
| 2022 | $1,392 | $25,829 | $4,296 | $21,533 |
| 2021 | $1,354 | $24,441 | $4,065 | $20,376 |
| 2020 | $1,360 | $23,838 | $3,965 | $19,873 |
| 2019 | $1,419 | $23,602 | $3,926 | $19,676 |
| 2018 | $1,639 | $27,390 | $4,419 | $22,971 |
| 2017 | $1,635 | $27,390 | $4,419 | $22,971 |
| 2016 | $1,553 | $25,444 | $4,105 | $21,339 |
| 2015 | -- | $24,865 | $4,012 | $20,853 |
| 2014 | -- | $21,709 | $2,581 | $19,128 |
| 2010 | -- | $20,268 | $2,602 | $17,666 |
Source: Public Records
Map
Nearby Homes
- 305 N Cooper St
- 702 W Maple St
- 202 E Maple St
- 1229 Township Road 1800e
- 1060 Centennial Ave
- 1000 Ellison Creek Rd
- 166 State Highway 94
- 419 Crane Hill Rd
- 208 W Washington St
- 0 Carman Rd
- 209 E Main St
- 792 Water St N
- 305 E Division St
- 114 Oak St
- 110 Oak St
- 1063 Second St
- 181 Aviston St
- 344 S Benton St
- 831 E Atchison St
- 11 Cascade Terrace
- 201 S Logan St
- 219 S Logan St
- 208 S Cooper St
- 212 S Cooper St
- 418 W Nichols St
- 202 S Cooper St
- 222 S Cooper St
- 501 Oakwood Dr
- 200 S Logan St Unit 108
- 302 S Logan St
- 120 S Logan St
- 303 Logan S
- 120 S Cooper St
- 115 S Logan St
- 201 S Cooper St
- 303 S Logan St
- 322 W Dixson St
- 110 S Logan St
- 215 S Cooper St
- 109 S Logan St