
Seller's Agent in 2026
Sladic Pajazetovic
Pajazetovic & Company
(617) 785-6251
1 in this area
34 Total Sales
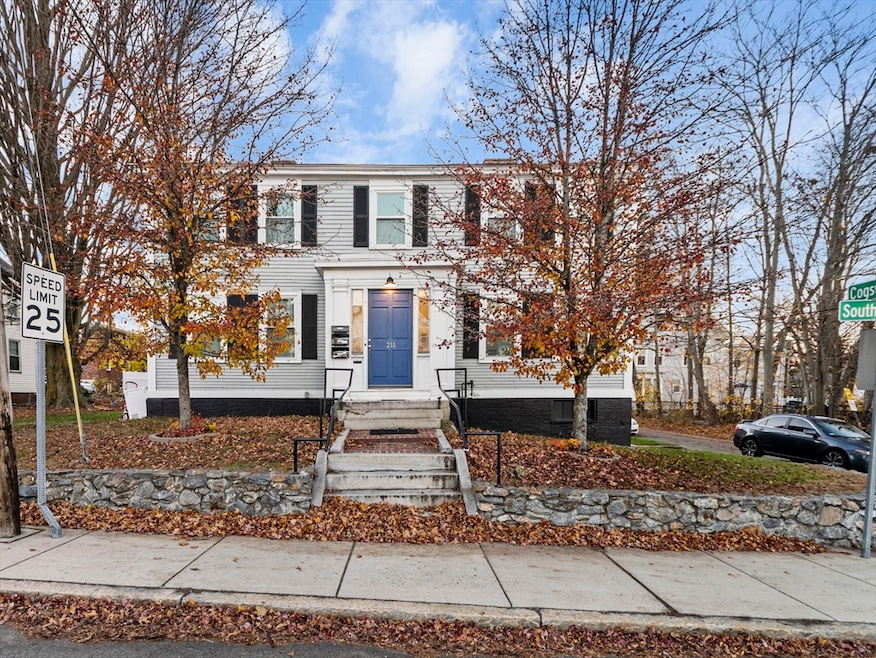
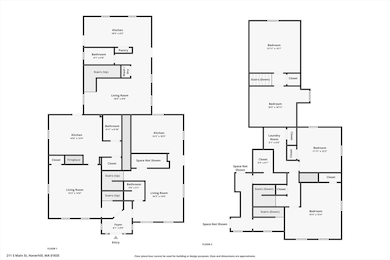
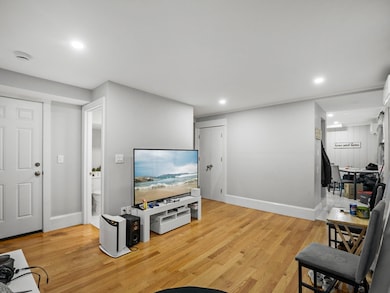
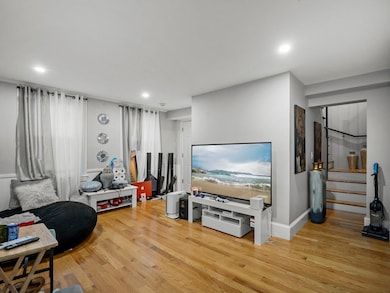
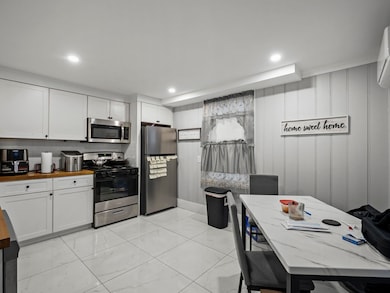
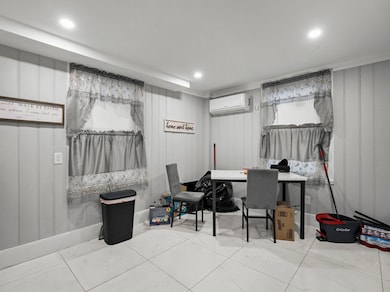
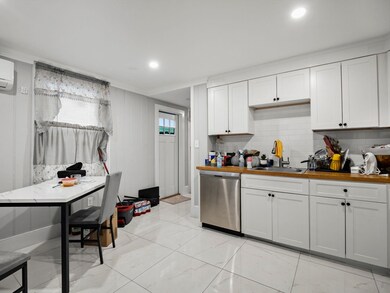
Well-maintained 3-family property in Haverhill’s Bradford area. Each unit offers 2 bedrooms, with two units updated in recent years. Unit 3 was fully rebuilt in 2023. The driveway was newly paved in 2024 and provides assigned off-street parking. Laundry in the units. All units are currently rented, offering strong rental income. Located blocks from downtown shopping, restaurants, and public transportation. This property is a solid addition to an investor’s portfolio and ready for its next owner.
| Date | Type | Sale Price | Title Company |
|---|---|---|---|
| Quit Claim Deed | $860,000 | -- | |
| Quit Claim Deed | -- | None Available | |
| Quit Claim Deed | -- | None Available | |
| Quit Claim Deed | -- | None Available | |
| Quit Claim Deed | -- | None Available | |
| Quit Claim Deed | -- | None Available | |
| Quit Claim Deed | $515,000 | None Available | |
| Quit Claim Deed | $515,000 | None Available | |
| Quit Claim Deed | $245,000 | -- | |
| Quit Claim Deed | $245,000 | -- | |
| Deed | -- | -- |
| Date | Status | Loan Amount | Loan Type |
|---|---|---|---|
| Open | $645,000 | New Conventional | |
| Previous Owner | $397,000 | New Conventional | |
| Previous Owner | $386,250 | Purchase Money Mortgage | |
| Previous Owner | $296,000 | New Conventional | |
| Previous Owner | $123,500 | Commercial | |
| Previous Owner | $75,000 | Commercial |
| Date | Event | Price | List to Sale | Price per Sq Ft | Prior Sale |
|---|---|---|---|---|---|
| 01/07/2026 01/07/26 | Sold | $853,500 | +1.7% | $244 / Sq Ft | |
| 11/26/2025 11/26/25 | Pending | -- | -- | -- | |
| 11/20/2025 11/20/25 | For Sale | $839,000 | +62.9% | $240 / Sq Ft | |
| 11/02/2022 11/02/22 | Sold | $515,000 | -6.4% | $178 / Sq Ft | View Prior Sale |
| 09/21/2022 09/21/22 | Pending | -- | -- | -- | |
| 08/18/2022 08/18/22 | Price Changed | $550,000 | -4.3% | $190 / Sq Ft | |
| 07/06/2022 07/06/22 | For Sale | $575,000 | +134.7% | $198 / Sq Ft | |
| 12/10/2018 12/10/18 | Sold | $245,000 | -9.2% | $77 / Sq Ft | View Prior Sale |
| 11/24/2018 11/24/18 | Pending | -- | -- | -- | |
| 11/08/2018 11/08/18 | Price Changed | $269,900 | 0.0% | $85 / Sq Ft | |
| 11/08/2018 11/08/18 | For Sale | $269,900 | -10.0% | $85 / Sq Ft | |
| 10/19/2018 10/19/18 | Pending | -- | -- | -- | |
| 10/12/2018 10/12/18 | For Sale | $299,900 | 0.0% | $94 / Sq Ft | |
| 10/03/2018 10/03/18 | Pending | -- | -- | -- | |
| 09/13/2018 09/13/18 | Price Changed | $299,900 | -4.0% | $94 / Sq Ft | |
| 07/30/2018 07/30/18 | Price Changed | $312,500 | -3.8% | $98 / Sq Ft | |
| 07/08/2018 07/08/18 | For Sale | $325,000 | 0.0% | $102 / Sq Ft | |
| 07/03/2018 07/03/18 | Pending | -- | -- | -- | |
| 06/25/2018 06/25/18 | For Sale | $325,000 | -- | $102 / Sq Ft |
| Year | Tax Paid | Tax Assessment Tax Assessment Total Assessment is a certain percentage of the fair market value that is determined by local assessors to be the total taxable value of land and additions on the property. | Land | Improvement |
|---|---|---|---|---|
| 2025 | $8,273 | $772,500 | $184,000 | $588,500 |
| 2024 | $6,728 | $632,300 | $184,000 | $448,300 |
| 2023 | $6,276 | $562,900 | $173,300 | $389,600 |
| 2022 | $6,405 | $503,500 | $165,600 | $337,900 |
| 2021 | $6,239 | $464,200 | $151,800 | $312,400 |
| 2020 | $0 | $353,800 | $147,200 | $206,600 |
| 2019 | $0 | $396,600 | $147,200 | $249,400 |
| 2018 | $0 | $384,500 | $141,100 | $243,400 |
| 2017 | $0 | $367,300 | $122,700 | $244,600 |
| 2016 | -- | $344,600 | $116,500 | $228,100 |
| 2015 | -- | $321,500 | $104,300 | $217,200 |
Seller's Agent in 2026
Sladic Pajazetovic
Pajazetovic & Company
(617) 785-6251
1 in this area
34 Total Sales
Seller Co-Listing Agent in 2026
Giselle Pajazetovic
Pajazetovic & Company
(617) 501-8512
3 in this area
90 Total Sales
Buyer's Agent in 2026
Jason Martinez
Realty ONE Group Nest
(617) 708-7171
1 in this area
43 Total Sales
Seller's Agent in 2022
Logyn Shea
Lock and Key Realty Inc.
(508) 735-1009
2 in this area
22 Total Sales
Seller's Agent in 2018
Frank Novak
Novak Finer Homes Realty
(978) 807-9576
30 Total Sales
Source: MLS Property Information Network (MLS PIN)
MLS Number: 73456894
APN: HAVE-000722-000653-000001
Disclaimer: Certain information contained herein is derived from information provided by parties other than Homes.com. All information provided is deemed reliable, but is not guaranteed to be accurate and should be independently verified.
![]() The property listing data and information, or the Images, set forth herein were provided to MLS Property Information Network, Inc. from third party sources, including sellers, lessors and public records, and were compiled by MLS Property Information Network, Inc. The property listing data and information, and the Images, are for the personal, non-commercial use of consumers having a good faith interest in purchasing or leasing listed properties of the type displayed to them and may not be used for any purpose other than to identify prospective properties which such consumers may have a good faith interest in purchasing or leasing. MLS Property Information Network, Inc. and its subscribers disclaim any and all representations and warranties as to the accuracy of the property listing data and information, or as to the accuracy of any of the Images, set forth herein.
The property listing data and information, or the Images, set forth herein were provided to MLS Property Information Network, Inc. from third party sources, including sellers, lessors and public records, and were compiled by MLS Property Information Network, Inc. The property listing data and information, and the Images, are for the personal, non-commercial use of consumers having a good faith interest in purchasing or leasing listed properties of the type displayed to them and may not be used for any purpose other than to identify prospective properties which such consumers may have a good faith interest in purchasing or leasing. MLS Property Information Network, Inc. and its subscribers disclaim any and all representations and warranties as to the accuracy of the property listing data and information, or as to the accuracy of any of the Images, set forth herein.
Ask me questions while you tour the home.