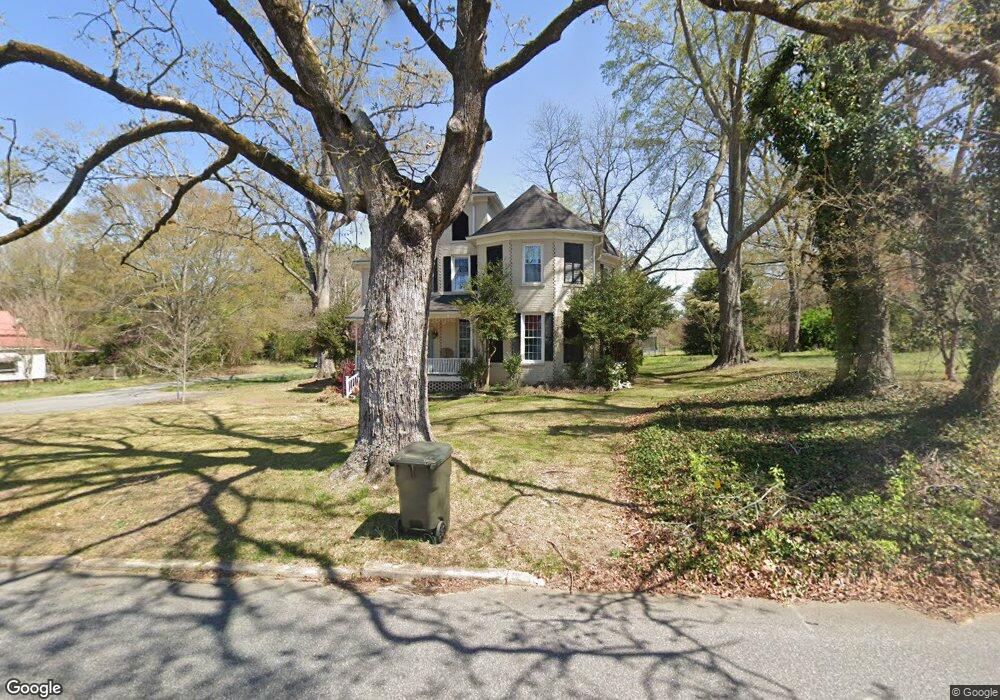
211 S Main St Honea Path, SC 29654
Estimated Value: $240,267 - $405,000
4
Beds
--
Bath
3,886
Sq Ft
$84/Sq Ft
Est. Value
About This Home
This home is located at 211 S Main St, Honea Path, SC 29654 and is currently estimated at $324,567, approximately $83 per square foot. 211 S Main St is a home located in Anderson County with nearby schools including Belton Honea Path High School and Whispering Pines Mennonite School.
Ownership History
Date
Name
Owned For
Owner Type
Purchase Details
Closed on
Aug 26, 2013
Sold by
Evans Cecil E
Bought by
Kabel Corinne C
Current Estimated Value
Home Financials for this Owner
Home Financials are based on the most recent Mortgage that was taken out on this home.
Original Mortgage
$50,000
Outstanding Balance
$37,297
Interest Rate
4.39%
Mortgage Type
Credit Line Revolving
Estimated Equity
$287,270
Purchase Details
Closed on
Jun 3, 2013
Sold by
Evans Cecil
Bought by
Kabel Corinne C
Home Financials for this Owner
Home Financials are based on the most recent Mortgage that was taken out on this home.
Original Mortgage
$85,000
Interest Rate
3.42%
Mortgage Type
Seller Take Back
Purchase Details
Closed on
May 23, 2011
Sold by
Evans Cecil Eugene
Bought by
Evans Cecil and Cecil Evans Family Trust
Purchase Details
Closed on
Apr 9, 2010
Sold by
Evans Cecil Eugene and Evans Cecil E
Bought by
Evans Mary M and Kennedy Mary Evans
Purchase Details
Closed on
Jun 11, 2009
Sold by
Estate Of Gale Martin Evans and Evans Cecil Eugene
Bought by
Evans Cecil Eugene
Create a Home Valuation Report for This Property
The Home Valuation Report is an in-depth analysis detailing your home's value as well as a comparison with similar homes in the area
Home Values in the Area
Average Home Value in this Area
Purchase History
| Date | Buyer | Sale Price | Title Company |
|---|---|---|---|
| Kabel Corinne C | -- | -- | |
| Kabel Corinne C | $85,000 | -- | |
| Evans Cecil | -- | -- | |
| Evans Mary M | -- | -- | |
| Evans Cecil Eugene | -- | -- |
Source: Public Records
Mortgage History
| Date | Status | Borrower | Loan Amount |
|---|---|---|---|
| Open | Kabel Corinne C | $50,000 | |
| Previous Owner | Kabel Corinne C | $85,000 |
Source: Public Records
Tax History
| Year | Tax Paid | Tax Assessment Tax Assessment Total Assessment is a certain percentage of the fair market value that is determined by local assessors to be the total taxable value of land and additions on the property. | Land | Improvement |
|---|---|---|---|---|
| 2024 | $1,570 | $6,090 | $700 | $5,390 |
| 2023 | $1,530 | $6,090 | $700 | $5,390 |
| 2022 | $1,462 | $6,090 | $700 | $5,390 |
| 2021 | $1,328 | $5,400 | $340 | $5,060 |
| 2020 | $1,328 | $5,400 | $340 | $5,060 |
| 2019 | $1,328 | $5,400 | $340 | $5,060 |
| 2018 | $1,334 | $5,400 | $340 | $5,060 |
| 2017 | -- | $5,400 | $340 | $5,060 |
| 2016 | $1,469 | $5,970 | $240 | $5,730 |
| 2015 | $1,533 | $8,950 | $360 | $8,590 |
| 2014 | $4,219 | $5,970 | $240 | $5,730 |
Source: Public Records
Map
Nearby Homes
- 207 S Main St
- 213 S Main St
- 206 S Main St
- 205 S Main St
- 219 S Main St
- 220 S Main St
- 228 S Main St
- 203 S Main St
- 224 S Main St
- 216 S Main St
- 126 Church St
- 202 W Hampton Ave
- 108 W Hampton Ave
- 110 W Hampton Ave
- 204 W Hampton Ave
- 210 W Hampton Ave Unit A
- 210 W Hampton Ave
- 17 S Shirley Ave
- 113 W Hampton Ave
- 201 W Hampton Ave
Your Personal Tour Guide
Ask me questions while you tour the home.