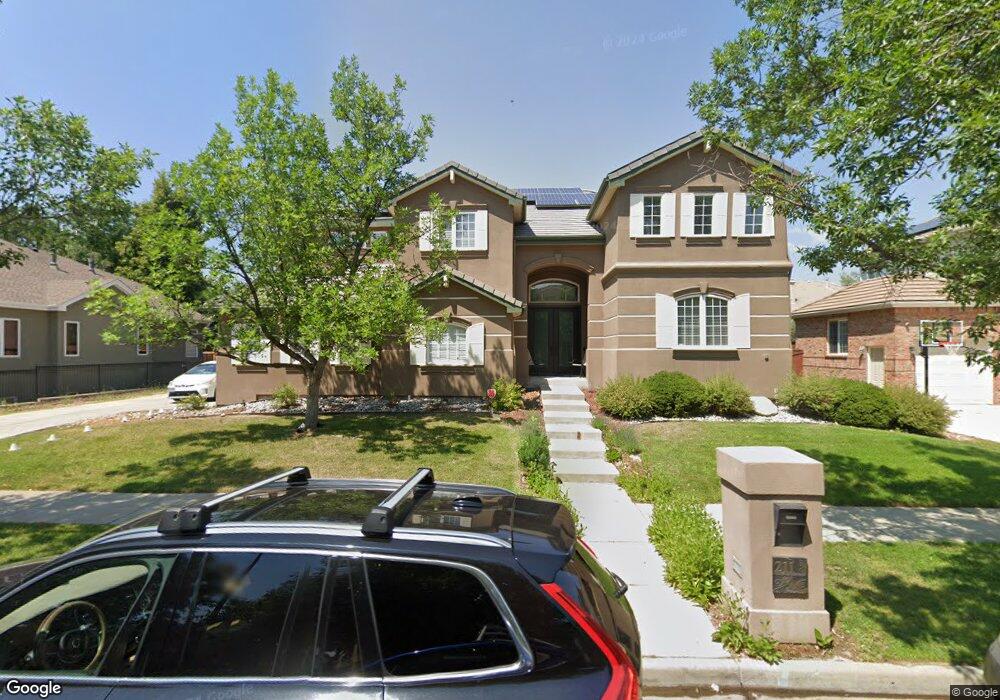
211 S Olive St Denver, CO 80230
Lowry NeighborhoodEstimated Value: $1,674,920 - $2,005,000
6
Beds
6
Baths
6,286
Sq Ft
$293/Sq Ft
Est. Value
About This Home
This home is located at 211 S Olive St, Denver, CO 80230 and is currently estimated at $1,841,480, approximately $292 per square foot. 211 S Olive St is a home located in Denver County with nearby schools including Lowry Elementary School, Hill Campus of Arts & Sciences, and George Washington High School.
Ownership History
Date
Name
Owned For
Owner Type
Purchase Details
Closed on
Oct 10, 2023
Sold by
Caver Tyrone L and Caver Cindy M
Bought by
Lighthouse Trust
Current Estimated Value
Purchase Details
Closed on
Sep 13, 2022
Sold by
Ogin Barry A
Bought by
Caver Tyrone L and Caver Cindy M
Purchase Details
Closed on
Oct 10, 2002
Sold by
Watson Robert E and Watson Lynda S
Bought by
Ogin Barry A and Cheng Grace Y
Home Financials for this Owner
Home Financials are based on the most recent Mortgage that was taken out on this home.
Original Mortgage
$788,000
Interest Rate
6.2%
Purchase Details
Closed on
Mar 31, 2000
Sold by
Richmond American Homes Of
Bought by
Watson Robert E and Watson Lynda S
Home Financials for this Owner
Home Financials are based on the most recent Mortgage that was taken out on this home.
Original Mortgage
$596,650
Interest Rate
7.75%
Create a Home Valuation Report for This Property
The Home Valuation Report is an in-depth analysis detailing your home's value as well as a comparison with similar homes in the area
Home Values in the Area
Average Home Value in this Area
Purchase History
| Date | Buyer | Sale Price | Title Company |
|---|---|---|---|
| Lighthouse Trust | -- | None Listed On Document | |
| Caver Tyrone L | $1,600,000 | New Title Company Name | |
| Ogin Barry A | $985,000 | First American Heritage Titl | |
| Watson Robert E | $745,866 | Stewart Title |
Source: Public Records
Mortgage History
| Date | Status | Borrower | Loan Amount |
|---|---|---|---|
| Previous Owner | Ogin Barry A | $788,000 | |
| Previous Owner | Watson Robert E | $596,650 |
Source: Public Records
Tax History Compared to Growth
Tax History
| Year | Tax Paid | Tax Assessment Tax Assessment Total Assessment is a certain percentage of the fair market value that is determined by local assessors to be the total taxable value of land and additions on the property. | Land | Improvement |
|---|---|---|---|---|
| 2024 | $9,249 | $116,780 | $17,430 | $99,350 |
| 2023 | $9,049 | $116,780 | $17,430 | $99,350 |
| 2022 | $7,155 | $89,970 | $19,160 | $70,810 |
| 2021 | $6,906 | $92,550 | $19,710 | $72,840 |
| 2020 | $6,816 | $91,860 | $19,710 | $72,150 |
| 2019 | $6,625 | $91,860 | $19,710 | $72,150 |
| 2018 | $6,573 | $84,960 | $19,850 | $65,110 |
| 2017 | $6,553 | $84,960 | $19,850 | $65,110 |
| 2016 | $6,931 | $84,990 | $18,809 | $66,181 |
| 2015 | $6,640 | $84,990 | $18,809 | $66,181 |
| 2014 | $6,223 | $74,930 | $10,229 | $64,701 |
Source: Public Records
Map
Nearby Homes
- 222 S Olive St
- 404 S Oneida Way
- 435 S Olive Way
- 43 S Oneida Ct
- 7055 E Virginia Ave
- 507 S Pontiac Way
- 434 S Newport Way
- 6820 E Lowry Blvd
- 6959 E Lowry Blvd
- 10 Oneida Ct
- 6758 E Lowry Blvd
- 18 Oneida Ct
- 308 S Locust St
- 6524 E Alaska Dr
- 6435 E Cedar Ave
- 441 S Monaco Pkwy
- 188 S Locust St
- 6975 E Irvington Place
- 41 Quince St
- 65 Newport St
- 221 S Olive St
- 201 S Olive St
- 210 S Oneida St
- 220 S Oneida St
- 200 S Oneida St
- 212 S Olive St
- 181 S Olive St
- 202 S Olive St
- 180 S Oneida St
- 241 S Olive St
- 242 S Olive St
- 240 S Oneida St
- 182 S Olive St
- 213 S Pontiac St
- 223 S Pontiac St
- 203 S Pontiac St
- 243 S Pontiac St
- 171 S Olive St
- 183 S Pontiac St
- 170 S Oneida St