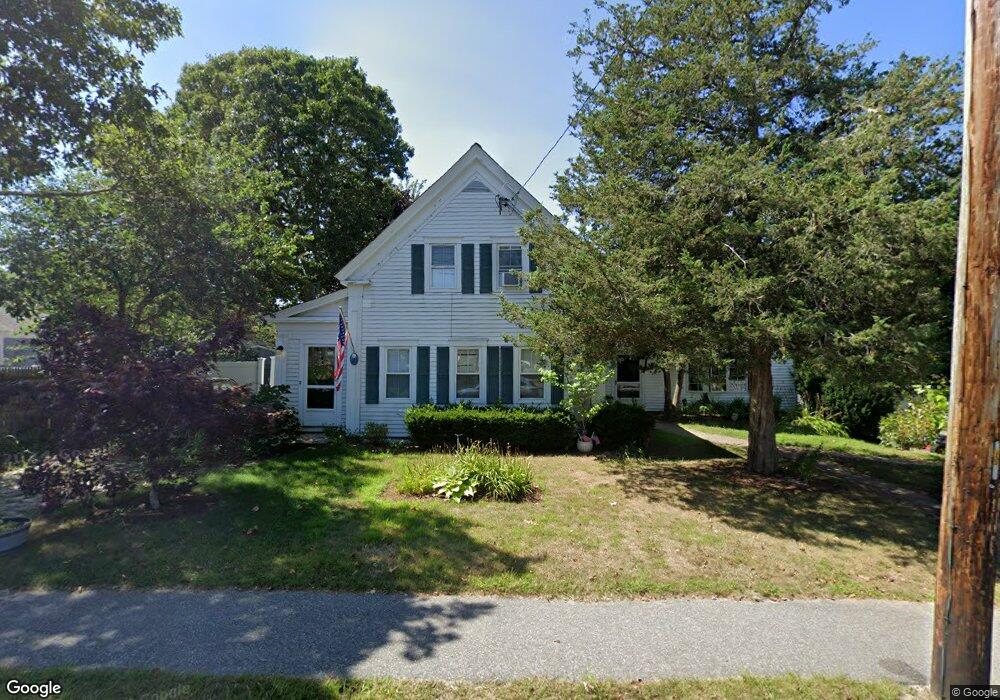
211 Sea St Dennis Port, MA 02639
Dennis Port NeighborhoodEstimated Value: $740,000 - $1,047,000
5
Beds
3
Baths
2,067
Sq Ft
$408/Sq Ft
Est. Value
About This Home
This home is located at 211 Sea St, Dennis Port, MA 02639 and is currently estimated at $843,376, approximately $408 per square foot. 211 Sea St is a home located in Barnstable County with nearby schools including Dennis-Yarmouth Regional High School and St. Pius X. School.
Ownership History
Date
Name
Owned For
Owner Type
Purchase Details
Closed on
Dec 18, 2023
Sold by
Livingston Flora I Est and Livingston
Bought by
Sullivan Michele and Sullivan Timothy J
Current Estimated Value
Home Financials for this Owner
Home Financials are based on the most recent Mortgage that was taken out on this home.
Original Mortgage
$325,730
Outstanding Balance
$320,060
Interest Rate
7.76%
Mortgage Type
Purchase Money Mortgage
Estimated Equity
$523,316
Purchase Details
Closed on
Jul 17, 1963
Bought by
Livingston Flora I
Create a Home Valuation Report for This Property
The Home Valuation Report is an in-depth analysis detailing your home's value as well as a comparison with similar homes in the area
Home Values in the Area
Average Home Value in this Area
Purchase History
| Date | Buyer | Sale Price | Title Company |
|---|---|---|---|
| Sullivan Michele | $362,325 | None Available | |
| Livingston Flora I | -- | -- |
Source: Public Records
Mortgage History
| Date | Status | Borrower | Loan Amount |
|---|---|---|---|
| Open | Sullivan Michele | $325,730 |
Source: Public Records
Tax History Compared to Growth
Tax History
| Year | Tax Paid | Tax Assessment Tax Assessment Total Assessment is a certain percentage of the fair market value that is determined by local assessors to be the total taxable value of land and additions on the property. | Land | Improvement |
|---|---|---|---|---|
| 2025 | $2,956 | $682,600 | $250,600 | $432,000 |
| 2024 | $2,880 | $656,100 | $241,000 | $415,100 |
| 2023 | $2,793 | $598,100 | $219,100 | $379,000 |
| 2022 | $2,705 | $483,100 | $197,400 | $285,700 |
| 2021 | $6,278 | $451,600 | $193,500 | $258,100 |
| 2020 | $2,603 | $426,700 | $178,600 | $248,100 |
| 2019 | $2,667 | $432,300 | $175,100 | $257,200 |
| 2018 | $2,570 | $405,400 | $180,600 | $224,800 |
| 2017 | $2,450 | $398,400 | $166,700 | $231,700 |
| 2016 | $2,408 | $368,700 | $173,700 | $195,000 |
| 2015 | $2,360 | $368,700 | $173,700 | $195,000 |
| 2014 | $2,216 | $348,900 | $152,800 | $196,100 |
Source: Public Records
Map
Nearby Homes
- 12 Cross St
- 159 Center St Unit 22
- 26 Manning Rd
- 10 Candlewood Ln Unit 2-1
- 12 Candlewood Ln Unit 2-9
- 102 Sea St
- 221 Upper County Rd Unit 2A
- 221 Upper County Rd Unit 2A
- 73 Division St
- 22 Ferncliff Rd
- 9 Country Ln
- 166 Upper County Rd Unit 1-4
- 402 Old Wharf Rd
- 402 Old Wharf Rd
- 47 Telegraph Rd Unit 1
- 11 Ocean Park W
- 72 Bassett Ln
- 268 Main St
- 405 Old Wharf Rd Unit B204
- 405 Old Wharf Rd Unit B204