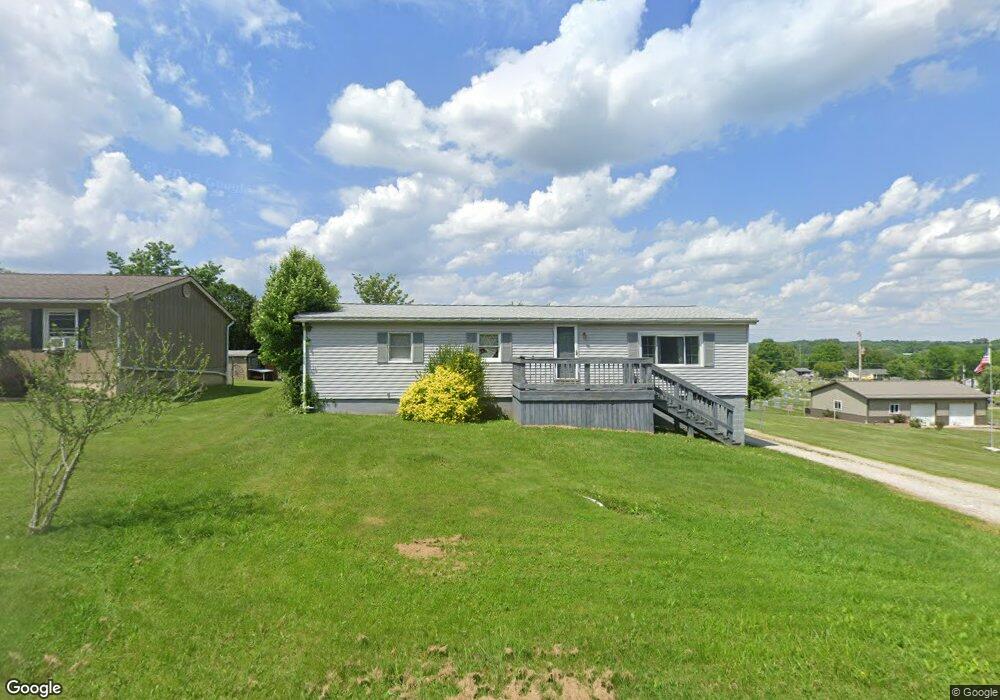
211 Sequoia Dr Byesville, OH 43723
Estimated Value: $159,201 - $193,000
3
Beds
2
Baths
1,248
Sq Ft
$145/Sq Ft
Est. Value
About This Home
This home is located at 211 Sequoia Dr, Byesville, OH 43723 and is currently estimated at $181,550, approximately $145 per square foot. 211 Sequoia Dr is a home with nearby schools including Meadowbrook High School, Foxfire East Academy, and Cherish Christian Academy.
Ownership History
Date
Name
Owned For
Owner Type
Purchase Details
Closed on
Jun 2, 2006
Sold by
Schupbach James D and Schupbach Diane L
Bought by
Long Bobby
Current Estimated Value
Home Financials for this Owner
Home Financials are based on the most recent Mortgage that was taken out on this home.
Original Mortgage
$67,200
Outstanding Balance
$4,449
Interest Rate
6.68%
Mortgage Type
New Conventional
Estimated Equity
$177,101
Purchase Details
Closed on
Aug 19, 2005
Sold by
Secretary Of Hud
Bought by
Schupbach James D and Schupbach Diane L
Home Financials for this Owner
Home Financials are based on the most recent Mortgage that was taken out on this home.
Original Mortgage
$31,750
Interest Rate
5.8%
Mortgage Type
Purchase Money Mortgage
Purchase Details
Closed on
Mar 1, 2005
Sold by
New Freedom Mortgage Corp
Bought by
Ravak Ii Edward L and Doe Jane
Purchase Details
Closed on
Jan 25, 2005
Sold by
Mers Inc
Bought by
Ravak Ii Edward L
Create a Home Valuation Report for This Property
The Home Valuation Report is an in-depth analysis detailing your home's value as well as a comparison with similar homes in the area
Purchase History
| Date | Buyer | Sale Price | Title Company |
|---|---|---|---|
| Long Bobby | $68,500 | -- | |
| Schupbach James D | $39,600 | -- | |
| Ravak Ii Edward L | -- | -- | |
| Ravak Ii Edward L | $50,000 | -- |
Source: Public Records
Mortgage History
| Date | Status | Borrower | Loan Amount |
|---|---|---|---|
| Open | Long Bobby | $67,200 | |
| Previous Owner | Schupbach James D | $31,750 |
Source: Public Records
Tax History
| Year | Tax Paid | Tax Assessment Tax Assessment Total Assessment is a certain percentage of the fair market value that is determined by local assessors to be the total taxable value of land and additions on the property. | Land | Improvement |
|---|---|---|---|---|
| 2024 | $1,547 | $39,110 | $5,534 | $33,576 |
| 2023 | $1,497 | $31,041 | $4,392 | $26,649 |
| 2022 | $1,291 | $31,040 | $4,390 | $26,650 |
| 2021 | $1,241 | $31,040 | $4,390 | $26,650 |
| 2020 | $1,183 | $30,060 | $4,420 | $25,640 |
| 2019 | $1,174 | $30,060 | $4,420 | $25,640 |
| 2018 | $1,104 | $30,060 | $4,420 | $25,640 |
| 2017 | $1,054 | $26,050 | $3,840 | $22,210 |
| 2016 | $1,039 | $26,050 | $3,840 | $22,210 |
| 2015 | $1,039 | $26,050 | $3,840 | $22,210 |
| 2014 | -- | $23,680 | $3,490 | $20,190 |
| 2013 | $963 | $23,680 | $3,490 | $20,190 |
Source: Public Records
Map
Nearby Homes
- 0 S 9th St
- 226 S 6th St
- 237 S 5th St
- 210 S 4th St
- 0 Main St
- 0 Greendale Ave
- 208 Meek Ave
- 132 N 10th St
- 9585 Country Club Estate Dr
- 0 Country Club Estate Dr Unit 5177842
- 0 Country Club Estate Dr Unit 5177851
- 0 Country Club Estate Dr Unit 5177854
- 0 Country Club Estate Dr Unit 5177868
- 0 Country Club Estate Dr Unit 5177846
- 0 Country Club Estate Dr Unit 5177860
- 0 Country Club Estate Dr Unit 5177843
- 9545 Country Club Estate Dr
- 0 Country Club Estate Dr Unit 5177862
- 0 Country Club Estate Dr Unit 5177853
- 0 Country Club Estate Dr Unit 5177857
- 6036 Sequoia Dr
- 213 Sequoia Dr
- 207 Sequoia Dr
- 214 Sequoia Dr
- 210 Greenbrier Dr
- 300 Sequoia Dr
- 203 Sequoia Dr
- 212 Greenbrier Dr
- 206 Sequoia Dr
- 302 Sequoia Dr
- 304 Sequoia Dr
- 111 Greenbrier Dr
- 200 Sequoia Dr
- 170 Greenbrier Dr
- 301 Sequoia Dr
- 100 Indian Hill Dr
- 102 Indian Hill Dr
- 201 Sequoia Dr
- 303 Sequoia Dr
- 305 Sequoia Dr
Your Personal Tour Guide
Ask me questions while you tour the home.