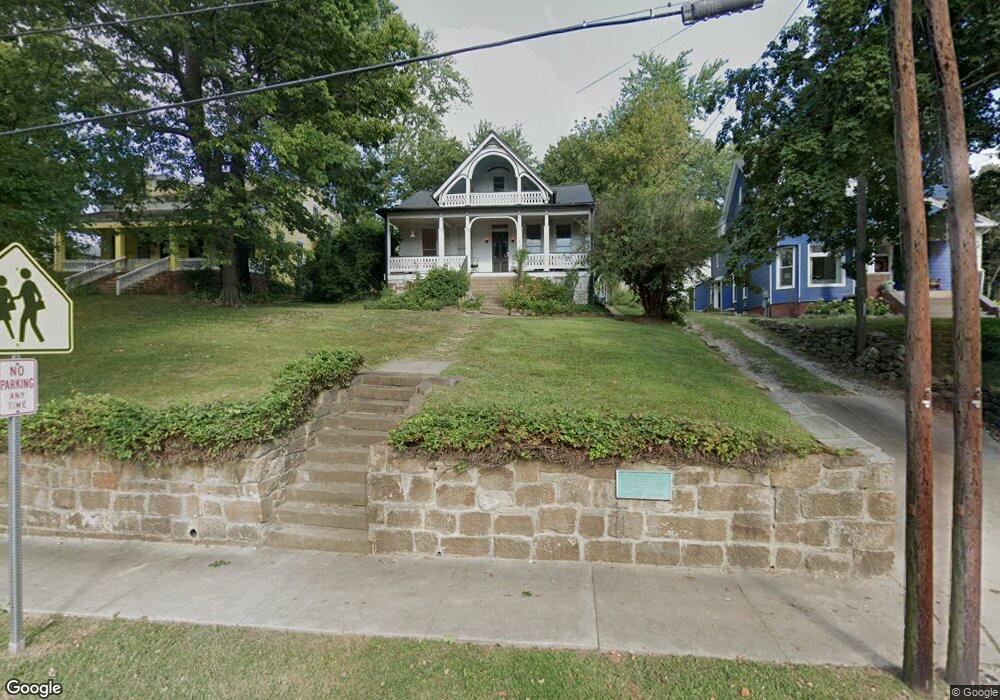
211 State St Newburgh, IN 47630
Estimated Value: $275,394 - $360,000
5
Beds
3
Baths
2,500
Sq Ft
$126/Sq Ft
Est. Value
About This Home
This home is located at 211 State St, Newburgh, IN 47630 and is currently estimated at $314,849, approximately $125 per square foot. 211 State St is a home located in Warrick County with nearby schools including Newburgh Elementary School, Castle North Middle School, and Castle High School.
Ownership History
Date
Name
Owned For
Owner Type
Purchase Details
Closed on
May 15, 2008
Sold by
Baker Jack R and Baker Patricia
Bought by
Wargel Stephen D
Current Estimated Value
Home Financials for this Owner
Home Financials are based on the most recent Mortgage that was taken out on this home.
Original Mortgage
$155,000
Interest Rate
5.87%
Mortgage Type
New Conventional
Purchase Details
Closed on
May 10, 2006
Sold by
Rexing Kelle M
Bought by
Baker Jack R and Baker Patricia
Home Financials for this Owner
Home Financials are based on the most recent Mortgage that was taken out on this home.
Original Mortgage
$176,000
Interest Rate
6.39%
Mortgage Type
New Conventional
Create a Home Valuation Report for This Property
The Home Valuation Report is an in-depth analysis detailing your home's value as well as a comparison with similar homes in the area
Home Values in the Area
Average Home Value in this Area
Purchase History
| Date | Buyer | Sale Price | Title Company |
|---|---|---|---|
| Wargel Stephen D | -- | None Available | |
| Baker Jack R | -- | None Available |
Source: Public Records
Mortgage History
| Date | Status | Borrower | Loan Amount |
|---|---|---|---|
| Closed | Wargel Stephen D | $155,000 | |
| Previous Owner | Baker Jack R | $176,000 |
Source: Public Records
Tax History Compared to Growth
Tax History
| Year | Tax Paid | Tax Assessment Tax Assessment Total Assessment is a certain percentage of the fair market value that is determined by local assessors to be the total taxable value of land and additions on the property. | Land | Improvement |
|---|---|---|---|---|
| 2024 | $3,153 | $204,600 | $42,700 | $161,900 |
| 2023 | $1,892 | $212,800 | $42,700 | $170,100 |
| 2022 | $2,033 | $208,000 | $42,700 | $165,300 |
| 2021 | $1,778 | $177,800 | $19,500 | $158,300 |
| 2020 | $1,827 | $182,700 | $19,500 | $163,200 |
| 2019 | $1,827 | $182,700 | $19,500 | $163,200 |
| 2018 | $1,787 | $178,700 | $19,500 | $159,200 |
| 2017 | $1,729 | $172,900 | $19,500 | $153,400 |
| 2016 | $1,716 | $171,600 | $19,500 | $152,100 |
| 2014 | $1,681 | $178,000 | $12,300 | $165,700 |
| 2013 | $1,656 | $179,900 | $12,300 | $167,600 |
Source: Public Records
Map
Nearby Homes
- 116 Sycamore St
- 405 Middle St
- 110 Monroe St
- 210 E Main St
- 101 E Jennings St Unit E
- 519 Monroe St
- 223 W Jennings St
- 317 W Water St
- 422 W Water St
- 5599 Victoria Ct
- 912 Orchard Dr
- 1060 Jefferson Ct
- 0 Phelps Dr
- 622 Forest Park Dr
- 5610 Saint Catherine Ct
- 700 Coppers Edge Dr
- 105 Temple
- 6288 Sycamore Hollow
- 8634 Briarose Ct
- 1 Hillside Trail