Estimated Value: $262,413 - $299,000
4
Beds
3
Baths
1,863
Sq Ft
$149/Sq Ft
Est. Value
About This Home
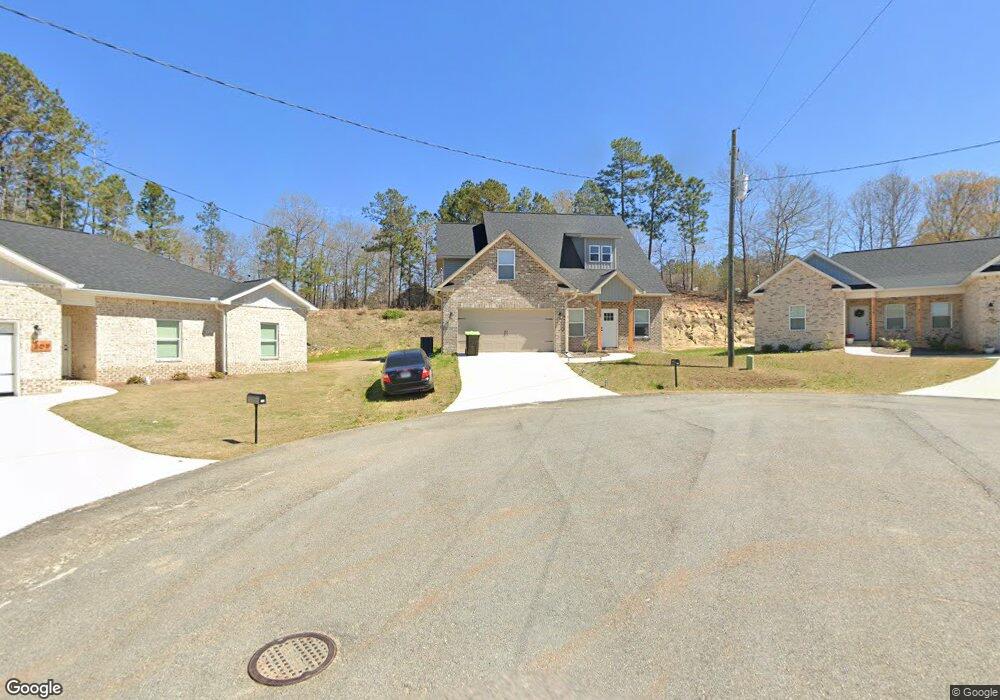
This home is located at 211 Sugar Maple Ct, Byron, GA 31008 and is currently estimated at $277,353, approximately $148 per square foot. 211 Sugar Maple Ct is a home located in Peach County with nearby schools including Byron Elementary School, Byron Middle School, and Peach County High School.
Ownership History
Date
Name
Owned For
Owner Type
Purchase Details
Closed on
Jul 1, 2024
Sold by
Nhd Homes Llc
Bought by
Finnigan Steven
Current Estimated Value
Home Financials for this Owner
Home Financials are based on the most recent Mortgage that was taken out on this home.
Original Mortgage
$284,998
Outstanding Balance
$280,603
Interest Rate
7.03%
Mortgage Type
VA
Estimated Equity
-$3,250
Purchase Details
Closed on
Aug 7, 2023
Sold by
Jrc3 Home Builders Llc
Bought by
Nhd Homes Llc
Home Financials for this Owner
Home Financials are based on the most recent Mortgage that was taken out on this home.
Original Mortgage
$186,400
Interest Rate
6.81%
Mortgage Type
New Conventional
Purchase Details
Closed on
May 4, 2022
Sold by
Lamendola Peter F
Bought by
Jrc3 Home Builders Llc
Purchase Details
Closed on
Dec 12, 2014
Sold by
Neisler Jeff
Bought by
The Foundation Of The Methodist Home
Purchase Details
Closed on
Sep 5, 2013
Sold by
State Bank & Trust Co
Bought by
Neisler Jeff
Purchase Details
Closed on
Mar 13, 2013
Sold by
Lee & Company Inc
Bought by
State Bank & Trust Company
Purchase Details
Closed on
Dec 14, 2006
Sold by
Alden Thomas H and Alden Brenda B
Bought by
Lee & Company Inc
Create a Home Valuation Report for This Property
The Home Valuation Report is an in-depth analysis detailing your home's value as well as a comparison with similar homes in the area
Home Values in the Area
Average Home Value in this Area
Purchase History
| Date | Buyer | Sale Price | Title Company |
|---|---|---|---|
| Finnigan Steven | $279,000 | -- | |
| Nhd Homes Llc | $38,900 | -- | |
| Jrc3 Home Builders Llc | $357,000 | -- | |
| The Foundation Of The Methodist Home | -- | -- | |
| Neisler Jeff | $20,625 | -- | |
| State Bank & Trust Company | -- | -- | |
| Lee & Company Inc | -- | -- |
Source: Public Records
Mortgage History
| Date | Status | Borrower | Loan Amount |
|---|---|---|---|
| Open | Finnigan Steven | $284,998 | |
| Previous Owner | Nhd Homes Llc | $186,400 |
Source: Public Records
Tax History
| Year | Tax Paid | Tax Assessment Tax Assessment Total Assessment is a certain percentage of the fair market value that is determined by local assessors to be the total taxable value of land and additions on the property. | Land | Improvement |
|---|---|---|---|---|
| 2025 | $4,164 | $119,360 | $15,240 | $104,120 |
| 2024 | $1,926 | $53,960 | $15,000 | $38,960 |
| 2023 | $496 | $13,800 | $13,800 | $0 |
| 2022 | $323 | $12,000 | $12,000 | $0 |
| 2021 | $375 | $12,000 | $12,000 | $0 |
| 2020 | $375 | $12,000 | $12,000 | $0 |
| 2019 | $47 | $12,000 | $12,000 | $0 |
| 2018 | $378 | $12,000 | $12,000 | $0 |
| 2017 | $380 | $12,000 | $12,000 | $0 |
| 2016 | $379 | $12,000 | $12,000 | $0 |
| 2015 | $379 | $12,000 | $12,000 | $0 |
| 2014 | $17 | $12,000 | $12,000 | $0 |
| 2013 | -- | $8,400 | $8,400 | $0 |
Source: Public Records
Map
Nearby Homes
- 204 Sugar Maple Ct
- 102 Silver Maple Ct
- 109 Silver Maple Ct
- 107 Silver Maple Ct
- 506 Howard St
- 110 Pine Crest Dr
- 711 Main St
- 103 Fawn Ct
- 104 Robinson St
- 103 Bellamy Way
- 103 Bellamy Way Unit LOT E7
- 209 Williamsburg Trail
- 104 Howard St
- 00 Rum Rd
- 105 Pine Hill Cir
- 416 Moseley Rd
- 107 Pine Hill Cir
- 101 Poppy Ln
- 00 Georgia 49
- 0 Rum Rd Unit 10673128
- 209 Sugar Maple Ct
- 208 Sugar Maple Ct
- 107 Aspen Dr
- 109 Aspen Dr
- 207 Sugar Maple Ct
- 105 Aspen Dr
- 206 Sugar Maple Ct
- 111 Aspen Dr
- 150 Alpine Dr
- 205 Sugar Maple Ct
- 202 Sugar Maple Ct
- 120 Aspen Dr Unit /253
- 120 Aspen Dr
- 122 Aspen Dr
- 122 Aspen Dr Unit /254
- 0 Sugar Maple Ct Unit 15 8055124
- 0 Sugar Maple Ct Unit 14 8055123
- 0 Sugar Maple Ct Unit 13 8055120
- 0 Sugar Maple Ct Unit 12 8055119
- 0 Sugar Maple Ct Unit 11 8055103
Your Personal Tour Guide
Ask me questions while you tour the home.