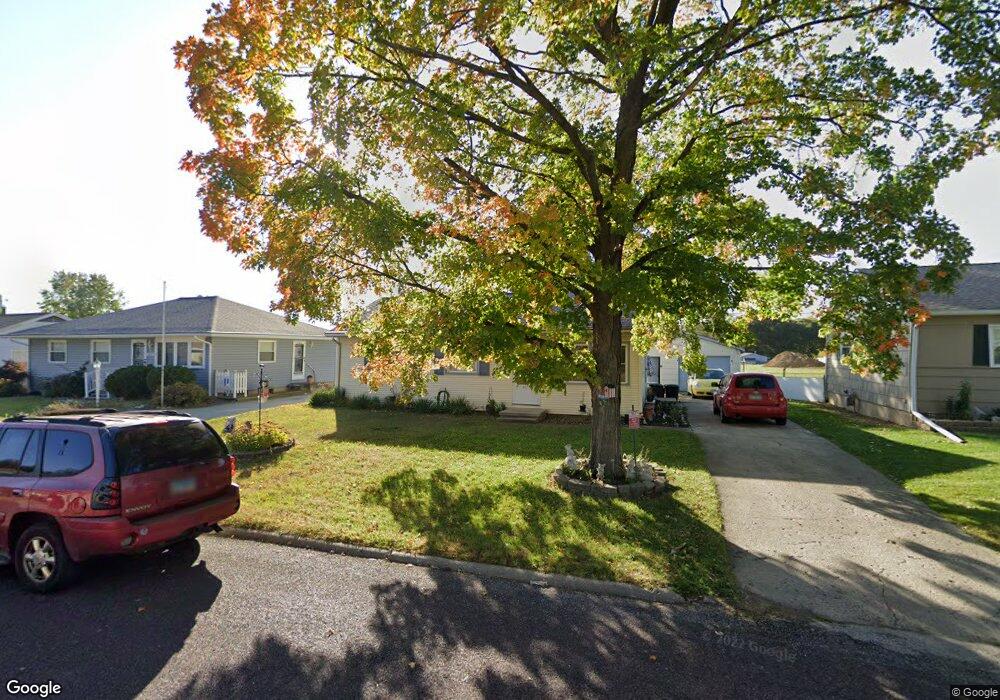
211 Temple Dr Washington, IL 61571
Sunnyland NeighborhoodEstimated Value: $132,073 - $163,000
3
Beds
1
Bath
925
Sq Ft
$155/Sq Ft
Est. Value
About This Home
This home is located at 211 Temple Dr, Washington, IL 61571 and is currently estimated at $143,768, approximately $155 per square foot. 211 Temple Dr is a home located in Tazewell County with nearby schools including J L Hensey Elementary School, Beverly Manor Elementary School, and Washington Community High School.
Ownership History
Date
Name
Owned For
Owner Type
Purchase Details
Closed on
May 27, 2016
Sold by
Morgan James A and Morgan Douglas W
Bought by
Hubbard Daniel
Current Estimated Value
Home Financials for this Owner
Home Financials are based on the most recent Mortgage that was taken out on this home.
Original Mortgage
$88,369
Outstanding Balance
$70,742
Interest Rate
3.75%
Mortgage Type
FHA
Estimated Equity
$73,026
Purchase Details
Closed on
Jul 28, 2010
Sold by
Morgan Faye A
Bought by
Morgan Faye A
Create a Home Valuation Report for This Property
The Home Valuation Report is an in-depth analysis detailing your home's value as well as a comparison with similar homes in the area
Home Values in the Area
Average Home Value in this Area
Purchase History
| Date | Buyer | Sale Price | Title Company |
|---|---|---|---|
| Hubbard Daniel | $90,000 | -- | |
| Morgan Faye A | -- | None Available |
Source: Public Records
Mortgage History
| Date | Status | Borrower | Loan Amount |
|---|---|---|---|
| Open | Hubbard Daniel | $88,369 |
Source: Public Records
Tax History
| Year | Tax Paid | Tax Assessment Tax Assessment Total Assessment is a certain percentage of the fair market value that is determined by local assessors to be the total taxable value of land and additions on the property. | Land | Improvement |
|---|---|---|---|---|
| 2024 | $2,318 | $36,190 | $5,270 | $30,920 |
| 2023 | $2,318 | $33,580 | $4,890 | $28,690 |
| 2022 | $2,217 | $31,380 | $4,570 | $26,810 |
| 2021 | $2,131 | $30,610 | $4,460 | $26,150 |
| 2020 | $2,124 | $30,610 | $4,460 | $26,150 |
| 2019 | $2,084 | $30,610 | $4,460 | $26,150 |
| 2018 | $2,043 | $30,610 | $4,460 | $26,150 |
| 2017 | $1,995 | $29,760 | $4,340 | $25,420 |
| 2016 | $1,552 | $29,760 | $4,340 | $25,420 |
| 2015 | $490 | $0 | $0 | $0 |
| 2013 | $473 | $10,000 | $10,000 | $0 |
Source: Public Records
Map
Nearby Homes
- 506 Lotus Ln
- 203 1/2 Mary St
- 612 W Bittersweet Rd
- 112 Briargate Rd
- 118 Florida Ave
- 401 Belaire Dr
- 143 Cherry Ln
- 208 Cherry Ln
- 230 Stahl Ave
- 107 Brookwood Ct
- 310 Dundee Rd
- 1440 School St
- 1 Plymouth Ct
- 106 Ruth Ct
- 102 Ruth Ct
- 501 Whistling Strait
- 111 Miromar Ln
- 100 Joseph Ct
- 107 Samuel Ct
- 211 Windsong Dr
Your Personal Tour Guide
Ask me questions while you tour the home.