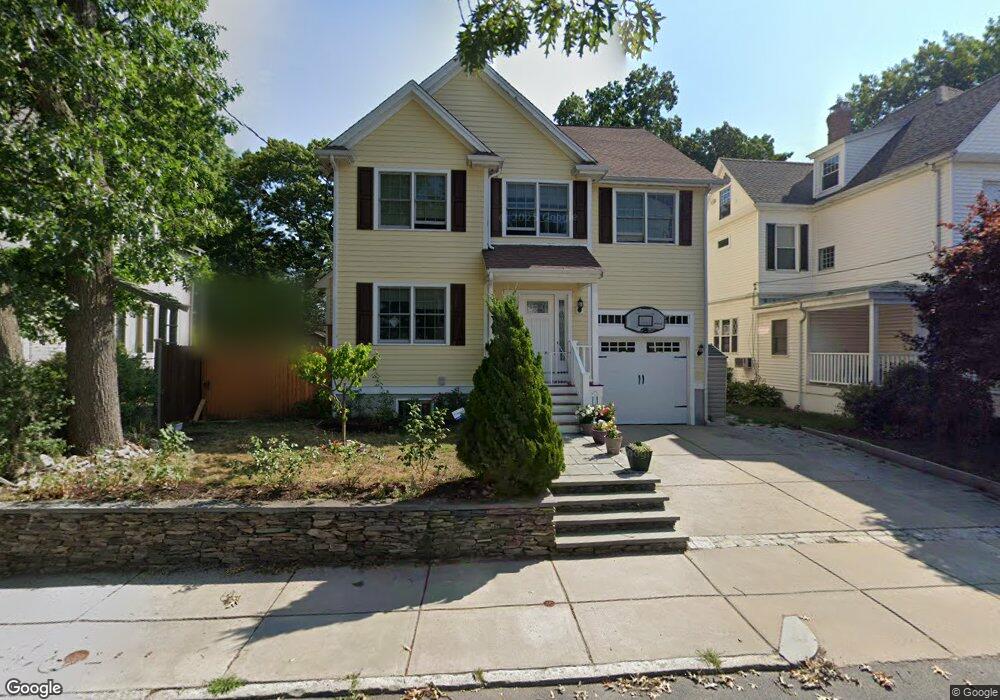
211 Temple St West Roxbury, MA 02132
West Roxbury NeighborhoodEstimated Value: $1,263,000 - $1,518,000
4
Beds
3
Baths
2,782
Sq Ft
$496/Sq Ft
Est. Value
About This Home
This home is located at 211 Temple St, West Roxbury, MA 02132 and is currently estimated at $1,378,572, approximately $495 per square foot. 211 Temple St is a home located in Suffolk County with nearby schools including St Theresa School, Holy Name Parish School, and Catholic Memorial School.
Ownership History
Date
Name
Owned For
Owner Type
Purchase Details
Closed on
Aug 18, 2015
Sold by
Yang Yongguang and Su Hui
Bought by
Zhou Qiang and Zheng Weijie
Current Estimated Value
Home Financials for this Owner
Home Financials are based on the most recent Mortgage that was taken out on this home.
Original Mortgage
$640,000
Outstanding Balance
$485,045
Interest Rate
3%
Mortgage Type
Purchase Money Mortgage
Estimated Equity
$893,527
Purchase Details
Closed on
Dec 30, 1998
Sold by
Lightner Consulting
Bought by
Ll Temple Street Rt
Create a Home Valuation Report for This Property
The Home Valuation Report is an in-depth analysis detailing your home's value as well as a comparison with similar homes in the area
Home Values in the Area
Average Home Value in this Area
Purchase History
| Date | Buyer | Sale Price | Title Company |
|---|---|---|---|
| Zhou Qiang | $800,000 | -- | |
| Ll Temple Street Rt | $54,900 | -- |
Source: Public Records
Mortgage History
| Date | Status | Borrower | Loan Amount |
|---|---|---|---|
| Open | Zhou Qiang | $640,000 | |
| Previous Owner | Ll Temple Street Rt | $300,000 | |
| Previous Owner | Ll Temple Street Rt | $406,000 | |
| Previous Owner | Ll Temple Street Rt | $410,000 |
Source: Public Records
Tax History Compared to Growth
Tax History
| Year | Tax Paid | Tax Assessment Tax Assessment Total Assessment is a certain percentage of the fair market value that is determined by local assessors to be the total taxable value of land and additions on the property. | Land | Improvement |
|---|---|---|---|---|
| 2025 | $13,880 | $1,198,600 | $254,100 | $944,500 |
| 2024 | $13,296 | $1,219,800 | $229,500 | $990,300 |
| 2023 | $12,478 | $1,161,800 | $218,600 | $943,200 |
| 2022 | $11,491 | $1,056,200 | $198,700 | $857,500 |
| 2021 | $10,873 | $1,019,000 | $194,800 | $824,200 |
| 2020 | $9,024 | $854,500 | $177,300 | $677,200 |
| 2019 | $8,535 | $809,800 | $148,700 | $661,100 |
| 2018 | $7,859 | $749,900 | $148,700 | $601,200 |
| 2017 | $7,783 | $734,900 | $148,700 | $586,200 |
| 2016 | $7,712 | $701,100 | $148,700 | $552,400 |
| 2015 | $8,100 | $668,900 | $164,600 | $504,300 |
| 2014 | $7,938 | $631,000 | $164,600 | $466,400 |
Source: Public Records
Map
Nearby Homes
- 183 Temple St
- 105 Chesbrough Rd
- 59 Chesbrough Rd
- 331 Vermont St
- 28 Dow Rd
- 9 Carroll St
- 73 Dent St Unit 1
- 340 Baker St Unit 1
- 539 Lagrange St
- 76 Potomac St
- 14 Sanborn Ave
- 1216 Vfw Pkwy Unit 40
- 76 Vermont St
- 1214 Vfw Pkwy Unit 30
- 1214 Vfw Pkwy Unit 37
- 89 Dwinell St
- 27-29 Temple St
- 577 Baker St Unit 577
- 425 Lagrange St Unit 203
- 7 Cass St Unit 6