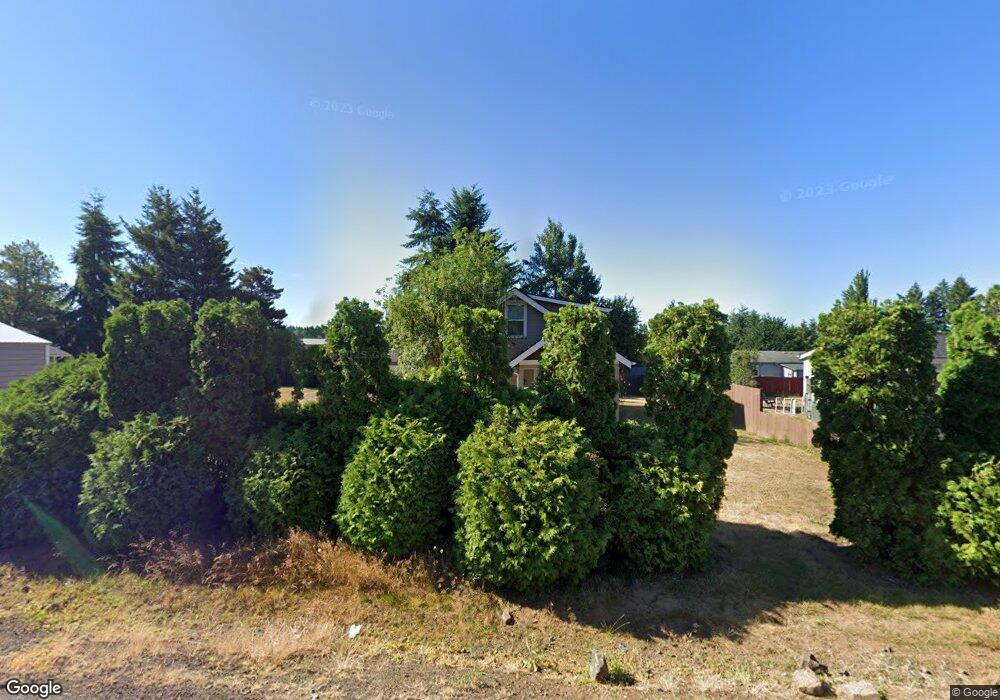
211 W Hemlock Ct Napavine, WA 98565
Estimated Value: $381,089 - $429,000
4
Beds
2
Baths
1,337
Sq Ft
$309/Sq Ft
Est. Value
About This Home
This home is located at 211 W Hemlock Ct, Napavine, WA 98565 and is currently estimated at $412,772, approximately $308 per square foot. 211 W Hemlock Ct is a home with nearby schools including Napavine Elementary School and Napavine Junior/Senior High School.
Ownership History
Date
Name
Owned For
Owner Type
Purchase Details
Closed on
Sep 7, 2018
Sold by
Brumley William E and Brumley Tressa M
Bought by
Eskola Stanley M and Eskola Charlotte M
Current Estimated Value
Home Financials for this Owner
Home Financials are based on the most recent Mortgage that was taken out on this home.
Original Mortgage
$138,600
Outstanding Balance
$120,618
Interest Rate
4.5%
Mortgage Type
New Conventional
Estimated Equity
$292,154
Purchase Details
Closed on
Apr 5, 2018
Sold by
Bank Of New York Mellon
Bought by
Brumley William E and Brumley Tressa M
Purchase Details
Closed on
Mar 20, 2018
Sold by
Bank Of Ny Mellon and Cwabs Inc #2006-25
Bought by
Brumley William E and Brumley Tressa M
Purchase Details
Closed on
Feb 2, 2018
Sold by
Young Brian S and Young Julie M
Bought by
Bank Of New York Mellon and Bank Of New York
Purchase Details
Closed on
Jan 26, 2018
Sold by
Young Brian S and Lewis County
Bought by
Bank Of Ny Mellon and Bank Of New York
Create a Home Valuation Report for This Property
The Home Valuation Report is an in-depth analysis detailing your home's value as well as a comparison with similar homes in the area
Home Values in the Area
Average Home Value in this Area
Purchase History
| Date | Buyer | Sale Price | Title Company |
|---|---|---|---|
| Eskola Stanley M | $230,888 | Title Guaranty | |
| Brumley William E | $79,600 | Lewis County Title | |
| Brumley William E | -- | New Title Company Name | |
| Bank Of New York Mellon | $130,721 | Lewis County Title | |
| Bank Of Ny Mellon | -- | New Title Company Name |
Source: Public Records
Mortgage History
| Date | Status | Borrower | Loan Amount |
|---|---|---|---|
| Open | Eskola Stanley M | $138,600 |
Source: Public Records
Tax History Compared to Growth
Tax History
| Year | Tax Paid | Tax Assessment Tax Assessment Total Assessment is a certain percentage of the fair market value that is determined by local assessors to be the total taxable value of land and additions on the property. | Land | Improvement |
|---|---|---|---|---|
| 2025 | $2,437 | $337,200 | $78,100 | $259,100 |
| 2024 | $2,437 | $339,400 | $61,000 | $278,400 |
| 2023 | $2,244 | $335,700 | $53,800 | $281,900 |
| 2022 | $2,022 | $271,100 | $37,700 | $233,400 |
| 2021 | $1,882 | $271,100 | $37,700 | $233,400 |
| 2020 | $1,851 | $230,700 | $33,900 | $196,800 |
| 2019 | $745 | $213,000 | $30,200 | $182,800 |
| 2018 | $808 | $83,800 | $30,200 | $53,600 |
| 2017 | $749 | $78,900 | $30,200 | $48,700 |
| 2016 | $726 | $73,800 | $27,000 | $46,800 |
| 2015 | $966 | $69,600 | $27,000 | $42,600 |
| 2013 | $966 | $62,100 | $27,000 | $35,100 |
Source: Public Records
Map
Nearby Homes
- 117 Maple Ave NW
- 423 3rd Ave NW
- 815 1st Ave NE
- 241 Parkside Loop
- 123 Stadium Way
- 203 E Parkwood Ct
- 110 Cedar Crest Place
- 427 Stadium Loop
- 441 Stadium Loop
- 213 Sommerville Rd
- 140 Bowers Rd
- 1962 Old Highway 603
- 0 Rush Rd Unit NWM2399032
- 278 Wind River Dr
- 286 Wind River Dr
- 284 Wind River Dr
- 282 Wind River Dr
- 0 Koontz Rd Unit NWM2447274
- 293 Wind River Dr
- 291 Wind River Dr
- 211 W Hemlock Ct
- 221 W Hemlock Ct
- 231 Maple Ave NW
- 220 Fir Ct
- 212 W Hemlock Ct
- 229 W Hemlock Ct
- 221 NW 2nd Ave NW
- 220 W Hemlock Ct
- 0 NW Grand Rd Unit 29037044
- 102 Volcano Ln
- 222 Fir Ct
- 224 NW Fir St
- 307 Maple Ave NW
- 205 Maple Ave NW
- 224 W Hemlock Ct
- 237 W Hemlock Ct
- 232 NW Fir St
- 221 W Branch St
- 213 W Branch St
- 222 Maple Ave NW Unit 23