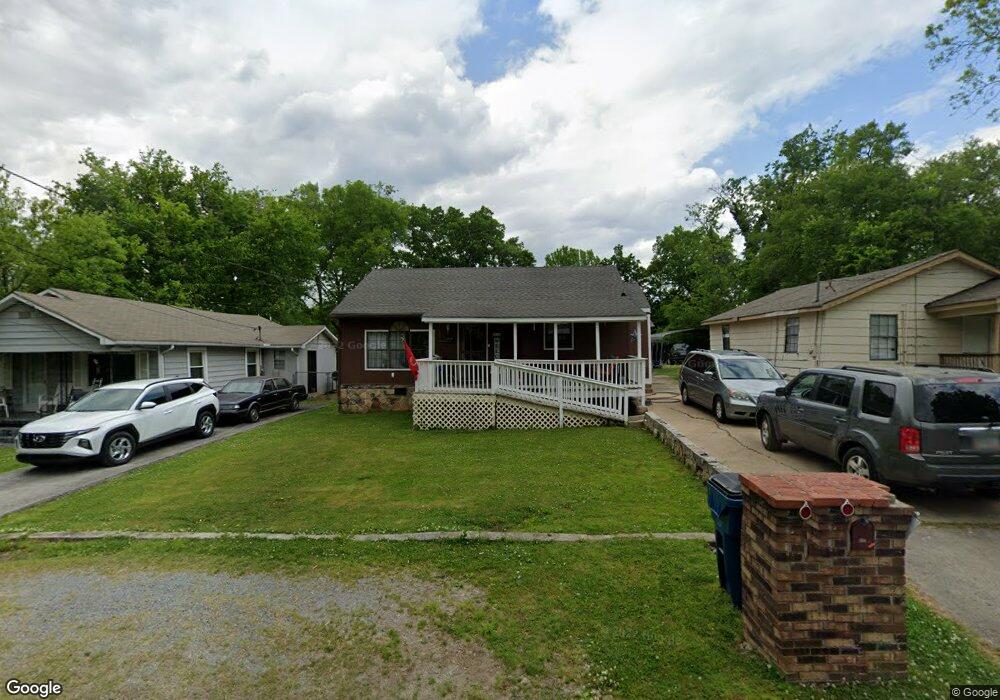
211 W Peachtree St Rossville, GA 30741
Estimated Value: $172,000 - $391,000
3
Beds
2
Baths
1,980
Sq Ft
$131/Sq Ft
Est. Value
About This Home
This home is located at 211 W Peachtree St, Rossville, GA 30741 and is currently estimated at $259,000, approximately $130 per square foot. 211 W Peachtree St is a home located in Walker County with nearby schools including Rossville Elementary School, Rossville Middle School, and Ridgeland High School.
Ownership History
Date
Name
Owned For
Owner Type
Purchase Details
Closed on
Feb 1, 1985
Sold by
Clark James E
Bought by
Beard Terry and Beard Glenda M
Current Estimated Value
Purchase Details
Closed on
Oct 17, 1984
Sold by
Clark Robert L
Bought by
Clark James E
Purchase Details
Closed on
Jul 6, 1983
Sold by
Century 21/Rozzell/Clark Real
Bought by
Clark Robert L
Purchase Details
Closed on
Jul 23, 1982
Sold by
Rozzell Frank W and Rozzell Robert L
Bought by
Century 21/Rozzell/Clark Real
Purchase Details
Closed on
Dec 30, 1981
Sold by
Fidelcore Mortgage Corporatio
Bought by
Rozzell Frank W and Rozzell Robert L
Purchase Details
Closed on
Jun 4, 1979
Sold by
Security Mortgage Investors
Bought by
Fidelcore Mortgage Corporatio
Purchase Details
Closed on
Jul 5, 1977
Bought by
Security Mortgage Investors
Create a Home Valuation Report for This Property
The Home Valuation Report is an in-depth analysis detailing your home's value as well as a comparison with similar homes in the area
Home Values in the Area
Average Home Value in this Area
Purchase History
| Date | Buyer | Sale Price | Title Company |
|---|---|---|---|
| Beard Terry | $30,000 | -- | |
| Clark James E | -- | -- | |
| Clark Robert L | -- | -- | |
| Century 21/Rozzell/Clark Real | -- | -- | |
| Rozzell Frank W | -- | -- | |
| Fidelcore Mortgage Corporatio | -- | -- | |
| Security Mortgage Investors | -- | -- |
Source: Public Records
Tax History Compared to Growth
Tax History
| Year | Tax Paid | Tax Assessment Tax Assessment Total Assessment is a certain percentage of the fair market value that is determined by local assessors to be the total taxable value of land and additions on the property. | Land | Improvement |
|---|---|---|---|---|
| 2024 | $1,725 | $54,191 | $2,944 | $51,247 |
| 2023 | $1,655 | $51,477 | $2,944 | $48,533 |
| 2022 | $1,120 | $44,562 | $2,944 | $41,618 |
| 2021 | $920 | $33,338 | $2,944 | $30,394 |
| 2020 | $801 | $28,122 | $2,944 | $25,178 |
| 2019 | $802 | $28,122 | $2,944 | $25,178 |
| 2018 | $837 | $28,122 | $2,944 | $25,178 |
| 2017 | $875 | $28,122 | $2,944 | $25,178 |
| 2016 | $474 | $19,188 | $2,944 | $16,244 |
| 2015 | $785 | $29,113 | $2,940 | $26,173 |
| 2014 | $755 | $29,113 | $2,940 | $26,173 |
| 2013 | -- | $29,113 | $2,940 | $26,173 |
Source: Public Records
Map
Nearby Homes
- 916 Logan Ave
- 200 W Oak St
- 1014 Lee Ave
- 806 Mcfarland Ave
- 816 Indian Ave
- 105 Elm St
- 1204 Wooden Ave
- 115 Beech St
- 126 S Liner St
- 405 Miami Ave
- 4 Carroll Ln
- 136 Summit St
- Lot 81 Battle Bluff Dr
- Lot 80 Battle Bluff Dr
- Lot 79 Battle Bluff Dr
- 0 Dempsey Ln Unit 1504691
- 189 Leinbach Rd
- 509 W Gordon Ave
- 527 W Gordon Ave
- 301 Dempsey Ln
- 209 W Peachtree St
- 213 W Peachtree St
- 215 W Peachtree St Unit 1
- 215 W Peachtree St
- 216 W Peachtree St
- 207 W Peachtree St
- 304 Cherry St
- 302 Cherry St
- W W Peachtree St
- 212 W Peachtree St
- 206 W Oak St
- 210 W Peachtree St
- 404 Cherry St
- 300 Cherry St
- 206 W Peachtree St
- 801 Lee Ave
- 201 W Peachtree St
- 202 W Peachtree St
- 307 Cherry St
- 805 Lee Ave