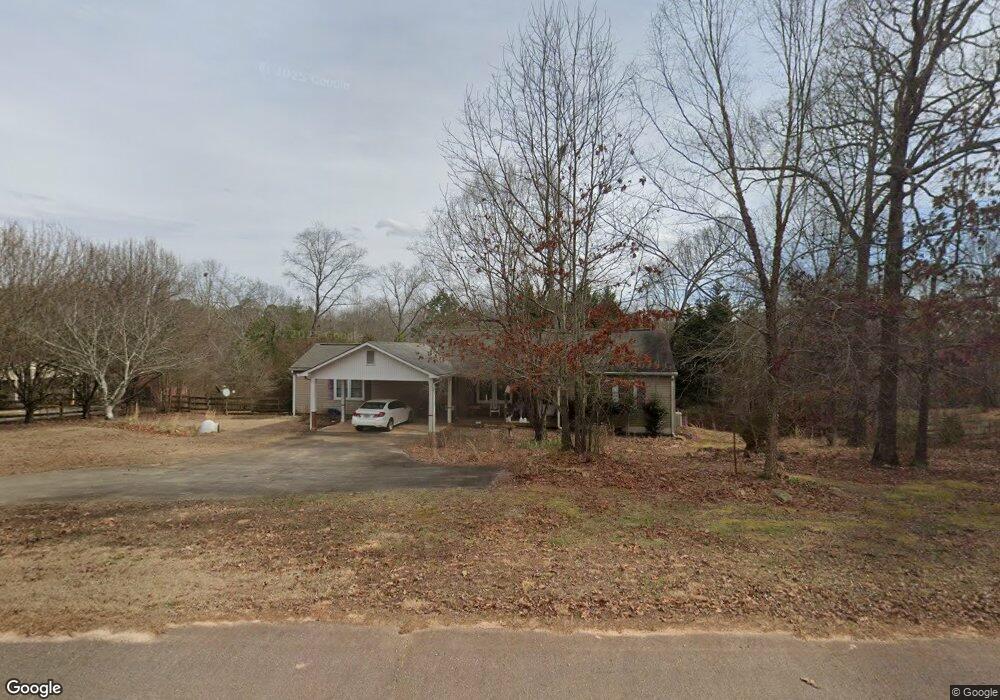
211 W Pinewood Dr Dahlonega, GA 30533
Estimated Value: $259,000 - $356,000
3
Beds
2
Baths
1,728
Sq Ft
$174/Sq Ft
Est. Value
About This Home
This home is located at 211 W Pinewood Dr, Dahlonega, GA 30533 and is currently estimated at $299,918, approximately $173 per square foot. 211 W Pinewood Dr is a home located in Lumpkin County with nearby schools including Clay County Middle School and Lumpkin County High School.
Ownership History
Date
Name
Owned For
Owner Type
Purchase Details
Closed on
Apr 23, 2010
Sold by
Bank Of America
Bought by
Otis Diane B
Current Estimated Value
Home Financials for this Owner
Home Financials are based on the most recent Mortgage that was taken out on this home.
Original Mortgage
$77,569
Outstanding Balance
$52,927
Interest Rate
5.5%
Mortgage Type
FHA
Estimated Equity
$246,991
Purchase Details
Closed on
Dec 1, 2009
Sold by
Demeo Patricia Susan
Bought by
Bank Of America
Purchase Details
Closed on
Mar 1, 2004
Sold by
Bennett Royce and Bennett Hilda
Bought by
Demeo Patricia Susan
Home Financials for this Owner
Home Financials are based on the most recent Mortgage that was taken out on this home.
Original Mortgage
$123,322
Interest Rate
5.68%
Mortgage Type
FHA
Create a Home Valuation Report for This Property
The Home Valuation Report is an in-depth analysis detailing your home's value as well as a comparison with similar homes in the area
Home Values in the Area
Average Home Value in this Area
Purchase History
| Date | Buyer | Sale Price | Title Company |
|---|---|---|---|
| Otis Diane B | $79,000 | -- | |
| Bank Of America | $82,000 | -- | |
| Demeo Patricia Susan | $135,000 | -- |
Source: Public Records
Mortgage History
| Date | Status | Borrower | Loan Amount |
|---|---|---|---|
| Open | Otis Diane B | $77,569 | |
| Previous Owner | Demeo Patricia Susan | $123,322 |
Source: Public Records
Tax History Compared to Growth
Tax History
| Year | Tax Paid | Tax Assessment Tax Assessment Total Assessment is a certain percentage of the fair market value that is determined by local assessors to be the total taxable value of land and additions on the property. | Land | Improvement |
|---|---|---|---|---|
| 2024 | $25 | $96,046 | $7,616 | $88,430 |
| 2023 | $1,655 | $89,909 | $7,616 | $82,293 |
| 2022 | $1,904 | $78,912 | $6,345 | $72,567 |
| 2021 | $1,699 | $66,383 | $6,345 | $60,038 |
| 2020 | $1,698 | $64,367 | $6,078 | $58,289 |
| 2019 | $1,714 | $64,367 | $6,078 | $58,289 |
| 2018 | $1,629 | $57,407 | $6,078 | $51,329 |
| 2017 | $1,585 | $54,807 | $6,078 | $48,729 |
| 2016 | $1,443 | $48,247 | $6,078 | $42,169 |
| 2015 | $1,285 | $48,247 | $6,078 | $42,169 |
| 2014 | $1,285 | $48,731 | $6,078 | $42,653 |
| 2013 | -- | $49,215 | $6,078 | $43,136 |
Source: Public Records
Map
Nearby Homes
- 0x Pink Williams Rd
- 0x Pink Williams Rd Unit 124AC
- 27 Bryn Ct
- 50 Hannahs Ct
- 6418 Dawsonville Hwy
- 0 Rider Rd Unit 7481902
- 0 Rider Rd Unit 10408283
- 1044 Rider Rd
- 382 Candler Ln
- 322 Miller Dr
- 49 Makers Way
- 437 Morgan Ln
- 460 Morgan Ln
- 194 Deerfield Dr
- 0 Rainmore Dr Unit 7620063
- 0 Rainmore Dr Unit 10570615
- 174 Morgan Ln
- 103 Rainmore Dr
- 136 Morgan Ln
- 114 Morgan Ln
- 201 W Pinewood Dr
- 241 W Pinewood Dr
- 240 W Pinewood Dr
- 242 W Pinewood Dr
- 109 W Pinewood Dr
- 188 W Pinewood Dr
- AC Pinewood Dr
- 186 W Pinewood Dr
- 325 W Pinewood Dr E
- 122 W Pinewood Dr
- 328 W Pinewood Dr
- 90 W Pinewood Dr
- 94 Oakwood Dr
- 178 Oakwood Dr
- 61 Norrell Dr
- W W Pinewood Dr
- 126 Oakwood Dr
- 0 Oakwood Dr
- 366 W Pinewood Dr
- 359 W Pinewood Dr