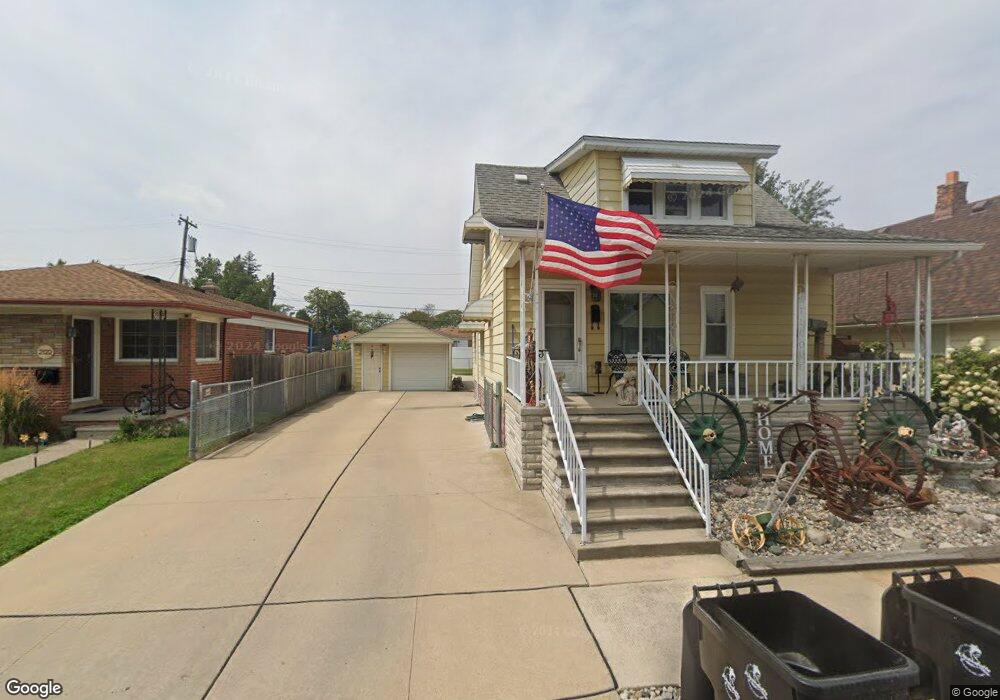
2110 11th St Wyandotte, MI 48192
Estimated Value: $152,000 - $184,000
3
Beds
1
Bath
1,122
Sq Ft
$154/Sq Ft
Est. Value
About This Home
This home is located at 2110 11th St, Wyandotte, MI 48192 and is currently estimated at $173,290, approximately $154 per square foot. 2110 11th St is a home located in Wayne County with nearby schools including Washington Elementary School, Woodrow Wilson School, and Roosevelt High School.
Ownership History
Date
Name
Owned For
Owner Type
Purchase Details
Closed on
Jul 21, 2009
Sold by
Albert C Janes & Pearl J Janes Revocable
Bought by
Sadler Jimmy D
Current Estimated Value
Home Financials for this Owner
Home Financials are based on the most recent Mortgage that was taken out on this home.
Original Mortgage
$60,000
Interest Rate
5.49%
Mortgage Type
Seller Take Back
Purchase Details
Closed on
Jul 20, 2001
Sold by
Janes Albert C
Bought by
Janes Albert C
Create a Home Valuation Report for This Property
The Home Valuation Report is an in-depth analysis detailing your home's value as well as a comparison with similar homes in the area
Home Values in the Area
Average Home Value in this Area
Purchase History
| Date | Buyer | Sale Price | Title Company |
|---|---|---|---|
| Sadler Jimmy D | $70,000 | Michigan Title Ins Agency In | |
| Sadler Jimmy D | $70,000 | Michican Title Insurance Age | |
| Janes Albert C | -- | -- |
Source: Public Records
Mortgage History
| Date | Status | Borrower | Loan Amount |
|---|---|---|---|
| Previous Owner | Sadler Jimmy D | $60,000 |
Source: Public Records
Tax History Compared to Growth
Tax History
| Year | Tax Paid | Tax Assessment Tax Assessment Total Assessment is a certain percentage of the fair market value that is determined by local assessors to be the total taxable value of land and additions on the property. | Land | Improvement |
|---|---|---|---|---|
| 2025 | $1,827 | $76,700 | $0 | $0 |
| 2024 | $1,827 | $74,300 | $0 | $0 |
| 2023 | $1,742 | $68,900 | $0 | $0 |
| 2022 | $2,018 | $62,400 | $0 | $0 |
| 2021 | $1,978 | $57,700 | $0 | $0 |
| 2020 | $1,950 | $51,900 | $0 | $0 |
| 2019 | $1,923 | $45,500 | $0 | $0 |
| 2018 | $1,535 | $40,800 | $0 | $0 |
| 2017 | $672 | $40,800 | $0 | $0 |
| 2016 | $1,857 | $37,800 | $0 | $0 |
| 2015 | $3,313 | $35,100 | $0 | $0 |
| 2013 | $3,210 | $32,100 | $0 | $0 |
| 2012 | $1,490 | $33,600 | $7,400 | $26,200 |
Source: Public Records
Map
Nearby Homes