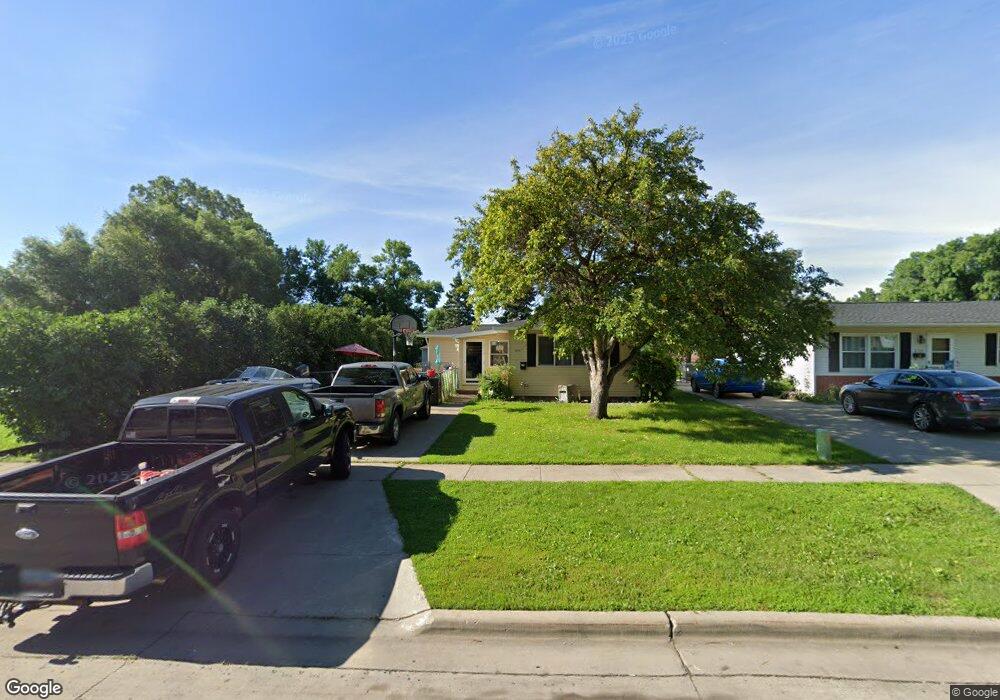
2110 5th Ave S Fargo, ND 58103
Jefferson-Carl NeighborhoodEstimated Value: $180,000 - $235,000
Studio
--
Bath
1,120
Sq Ft
$196/Sq Ft
Est. Value
About This Home
This home is located at 2110 5th Ave S, Fargo, ND 58103 and is currently estimated at $219,367, approximately $195 per square foot. 2110 5th Ave S is a home located in Cass County with nearby schools including Jefferson Elementary School, Carl Ben Eielson Middle School, and South High School.
Ownership History
Date
Name
Owned For
Owner Type
Purchase Details
Closed on
Apr 13, 2015
Sold by
Evenson Bradley J and Evenson Cheryl
Bought by
Shepherd Joshua M and Shepherd Alexandra
Current Estimated Value
Home Financials for this Owner
Home Financials are based on the most recent Mortgage that was taken out on this home.
Original Mortgage
$90,250
Outstanding Balance
$69,451
Interest Rate
3.73%
Mortgage Type
New Conventional
Estimated Equity
$149,916
Purchase Details
Closed on
Jun 3, 2008
Sold by
Lien Scott M and Lien Julie L
Bought by
Evenson Bradley J and Evenson Cheryl
Create a Home Valuation Report for This Property
The Home Valuation Report is an in-depth analysis detailing your home's value as well as a comparison with similar homes in the area
Home Values in the Area
Average Home Value in this Area
Purchase History
| Date | Buyer | Sale Price | Title Company |
|---|---|---|---|
| Shepherd Joshua M | $95,000 | Title Co | |
| Evenson Bradley J | -- | -- |
Source: Public Records
Mortgage History
| Date | Status | Borrower | Loan Amount |
|---|---|---|---|
| Open | Shepherd Joshua M | $90,250 |
Source: Public Records
Tax History
| Year | Tax Paid | Tax Assessment Tax Assessment Total Assessment is a certain percentage of the fair market value that is determined by local assessors to be the total taxable value of land and additions on the property. | Land | Improvement |
|---|---|---|---|---|
| 2024 | $3,202 | $104,650 | $19,050 | $85,600 |
| 2023 | $3,187 | $104,650 | $19,050 | $85,600 |
| 2022 | $3,160 | $101,600 | $19,050 | $82,550 |
| 2021 | $2,921 | $94,500 | $19,050 | $75,450 |
| 2020 | $2,910 | $94,500 | $19,050 | $75,450 |
| 2019 | $2,725 | $88,200 | $8,850 | $79,350 |
| 2018 | $2,692 | $88,200 | $8,850 | $79,350 |
| 2017 | $2,668 | $88,200 | $8,850 | $79,350 |
| 2016 | $2,379 | $85,650 | $8,850 | $76,800 |
| 2015 | $1,862 | $59,700 | $7,500 | $52,200 |
| 2014 | $1,827 | $56,850 | $7,500 | $49,350 |
| 2013 | $1,813 | $54,150 | $7,500 | $46,650 |
Source: Public Records
Map
Nearby Homes
- 2209 6th Ave S
- 702 21st St S
- 310 23rd St S
- 1718 6th Ave S
- 1909 9th Ave S
- 305 23rd St S
- 813 17th St S
- 904 18th St S
- 1101 22nd St S Unit 6
- 1622 7th Ave S
- 1129 22nd St S Unit B09
- 1129 22nd St S Unit B12
- 1625 9th Ave S
- 1629 2nd Ave S
- 719 15th St S
- 1524 1st Ave S
- 1422 8th Ave S
- 1421 19th St S
- 1419 23rd St S
- 1334 17th St S
Your Personal Tour Guide
Ask me questions while you tour the home.