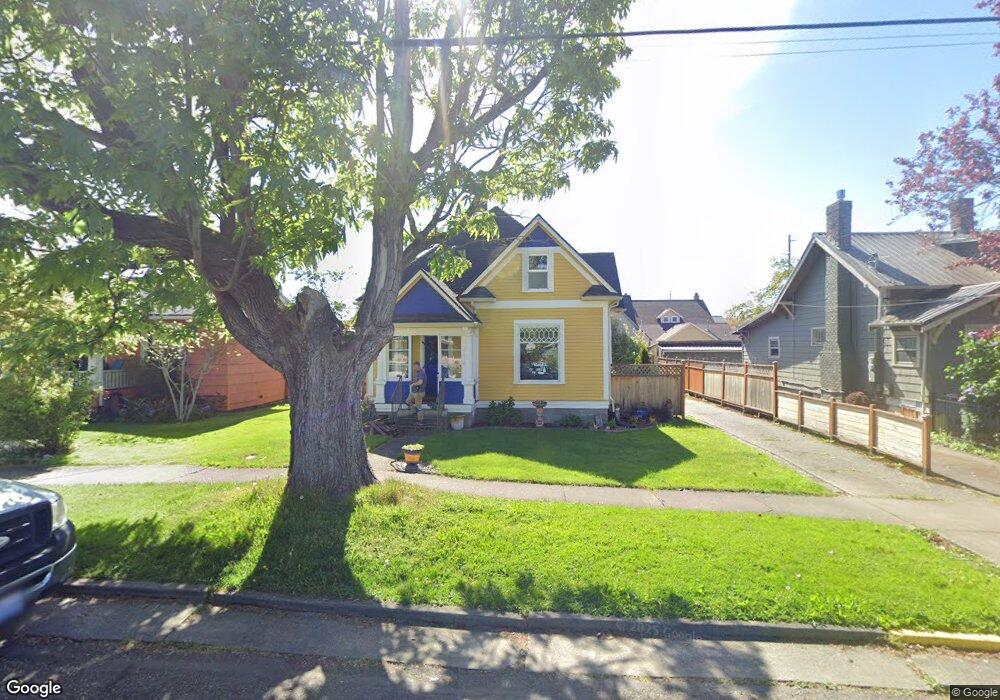
2110 C St Bellingham, WA 98225
Lettered Streets NeighborhoodEstimated Value: $632,295 - $704,000
4
Beds
2
Baths
1,489
Sq Ft
$447/Sq Ft
Est. Value
About This Home
This home is located at 2110 C St, Bellingham, WA 98225 and is currently estimated at $665,824, approximately $447 per square foot. 2110 C St is a home located in Whatcom County with nearby schools including Parkview Elementary School, Whatcom Middle School, and Bellingham High School.
Ownership History
Date
Name
Owned For
Owner Type
Purchase Details
Closed on
Aug 26, 2011
Sold by
Lever Christopher C and Lever Diane V
Bought by
Lopez Abel Ricardo and Cortes Zamora Marie Isabel
Current Estimated Value
Home Financials for this Owner
Home Financials are based on the most recent Mortgage that was taken out on this home.
Original Mortgage
$254,671
Outstanding Balance
$173,520
Interest Rate
4.46%
Mortgage Type
FHA
Estimated Equity
$492,304
Purchase Details
Closed on
Sep 30, 2002
Sold by
Shepardson Charles E and Stebbins Robin W
Bought by
Lever Christopher C and Lever Diane
Home Financials for this Owner
Home Financials are based on the most recent Mortgage that was taken out on this home.
Original Mortgage
$137,280
Interest Rate
6.16%
Purchase Details
Closed on
Apr 29, 2002
Sold by
Bye Dorothy N and Martin Leslie C
Bought by
Shepardson Charles E and Stebbins Robin W
Home Financials for this Owner
Home Financials are based on the most recent Mortgage that was taken out on this home.
Original Mortgage
$88,800
Interest Rate
7.37%
Purchase Details
Closed on
Apr 24, 2002
Sold by
Brown Patricia
Bought by
Bye Dorothy N and Martin Leslie C
Home Financials for this Owner
Home Financials are based on the most recent Mortgage that was taken out on this home.
Original Mortgage
$88,800
Interest Rate
7.37%
Create a Home Valuation Report for This Property
The Home Valuation Report is an in-depth analysis detailing your home's value as well as a comparison with similar homes in the area
Home Values in the Area
Average Home Value in this Area
Purchase History
| Date | Buyer | Sale Price | Title Company |
|---|---|---|---|
| Lopez Abel Ricardo | $261,580 | Stewart Title Company | |
| Lever Christopher C | $171,600 | Stewart Title Company | |
| Shepardson Charles E | $111,000 | Chicago Title Insurance | |
| Bye Dorothy N | -- | Chicago Title Insurance |
Source: Public Records
Mortgage History
| Date | Status | Borrower | Loan Amount |
|---|---|---|---|
| Open | Lopez Abel Ricardo | $254,671 | |
| Previous Owner | Lever Christopher C | $137,280 | |
| Previous Owner | Shepardson Charles E | $88,800 |
Source: Public Records
Tax History
| Year | Tax Paid | Tax Assessment Tax Assessment Total Assessment is a certain percentage of the fair market value that is determined by local assessors to be the total taxable value of land and additions on the property. | Land | Improvement |
|---|---|---|---|---|
| 2025 | $4,816 | $605,926 | $253,696 | $352,230 |
| 2024 | $4,695 | $588,271 | $246,304 | $341,967 |
| 2023 | $4,695 | $603,213 | $252,560 | $350,653 |
| 2022 | $3,834 | $520,020 | $217,728 | $302,292 |
| 2021 | $3,761 | $412,714 | $172,800 | $239,914 |
| 2020 | $3,683 | $382,143 | $160,000 | $222,143 |
| 2019 | $3,297 | $361,687 | $141,415 | $220,272 |
| 2018 | $3,320 | $324,665 | $126,965 | $197,700 |
| 2017 | $2,864 | $279,526 | $109,310 | $170,216 |
| 2016 | $2,506 | $251,975 | $98,090 | $153,885 |
| 2015 | $2,457 | $229,534 | $89,590 | $139,944 |
| 2014 | -- | $217,774 | $85,000 | $132,774 |
| 2013 | -- | $210,666 | $73,500 | $137,166 |
Source: Public Records
Map
Nearby Homes
- 2011 Cornwall Ave
- 2216 Dean Ave
- 1310 G St
- 2500 Cornwall Ave
- 409 Kentucky St
- 1200 W Holly St
- 1315 Astor St
- 2414 Elm St
- 1025 Granary Ave Unit 306
- 1025 Granary Ave Unit 506
- 1025 Granary Ave Unit 501-A
- 1025 Granary Ave Unit 307-B
- 1025 Granary Ave Unit 408
- 1025 Granary Ave Unit 407
- 1025 Granary Ave Unit 505
- 1025 Granary Ave Unit 308
- 1025 Granary Ave Unit 406
- 2600 Elm St
- 1310 Railroad Ave
- 605 Alabama St
Your Personal Tour Guide
Ask me questions while you tour the home.