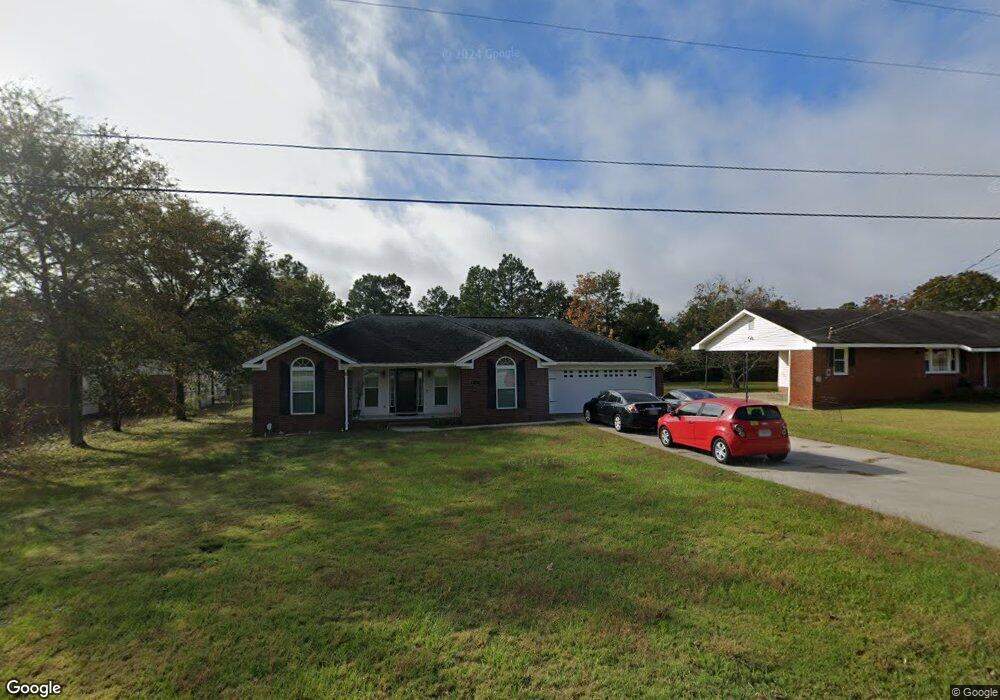
2110 Cassell St Augusta, GA 30906
Richmond Factory NeighborhoodEstimated Value: $201,000 - $249,000
3
Beds
2
Baths
1,683
Sq Ft
$138/Sq Ft
Est. Value
About This Home
This home is located at 2110 Cassell St, Augusta, GA 30906 and is currently estimated at $232,206, approximately $137 per square foot. 2110 Cassell St is a home located in Richmond County with nearby schools including Diamond Lakes Elementary School, Pine Hill Middle School, and Johnson Magnet.
Ownership History
Date
Name
Owned For
Owner Type
Purchase Details
Closed on
Aug 26, 2011
Sold by
Wells Fargo Bank Na Truste
Bought by
Osbourne Tanesha C
Current Estimated Value
Home Financials for this Owner
Home Financials are based on the most recent Mortgage that was taken out on this home.
Original Mortgage
$95,027
Outstanding Balance
$65,304
Interest Rate
4.64%
Mortgage Type
FHA
Estimated Equity
$166,902
Purchase Details
Closed on
Mar 1, 2011
Sold by
Lesure Linda V M
Bought by
Wells Fargo Bank Series 2007-2
Purchase Details
Closed on
Jun 22, 2006
Sold by
Birmingham Gregory P
Bought by
Stonebrook Builders Llc
Purchase Details
Closed on
Apr 27, 2006
Sold by
Miller Larry
Bought by
Birmingham Gregory P
Purchase Details
Closed on
Sep 30, 2005
Sold by
Smith Bennie H
Bought by
Miller Larry
Purchase Details
Closed on
Aug 20, 2003
Sold by
Bryer J Michael
Bought by
Frazier Gloria June C
Purchase Details
Closed on
Aug 15, 1990
Sold by
Frazier Henry E
Bought by
Bryer J Michael
Purchase Details
Closed on
Oct 1, 1976
Create a Home Valuation Report for This Property
The Home Valuation Report is an in-depth analysis detailing your home's value as well as a comparison with similar homes in the area
Home Values in the Area
Average Home Value in this Area
Purchase History
| Date | Buyer | Sale Price | Title Company |
|---|---|---|---|
| Osbourne Tanesha C | $97,500 | -- | |
| Wells Fargo Bank Series 2007-2 | $105,000 | -- | |
| Stonebrook Builders Llc | -- | None Available | |
| Birmingham Gregory P | $10,800 | None Available | |
| Miller Larry | $8,500 | -- | |
| Frazier Gloria June C | -- | -- | |
| Bryer J Michael | -- | -- | |
| -- | $3,000 | -- |
Source: Public Records
Mortgage History
| Date | Status | Borrower | Loan Amount |
|---|---|---|---|
| Open | Osbourne Tanesha C | $95,027 |
Source: Public Records
Tax History
| Year | Tax Paid | Tax Assessment Tax Assessment Total Assessment is a certain percentage of the fair market value that is determined by local assessors to be the total taxable value of land and additions on the property. | Land | Improvement |
|---|---|---|---|---|
| 2025 | $2,970 | $98,048 | $6,600 | $91,448 |
| 2024 | $2,970 | $70,455 | $6,600 | $63,855 |
| 2023 | $1,598 | $70,455 | $6,600 | $63,855 |
| 2022 | $2,229 | $70,455 | $6,600 | $63,855 |
| 2021 | $1,818 | $51,288 | $6,600 | $44,688 |
| 2020 | $1,791 | $51,288 | $6,600 | $44,688 |
| 2019 | $1,893 | $51,288 | $6,600 | $44,688 |
| 2018 | $1,664 | $51,288 | $6,600 | $44,688 |
| 2017 | $1,685 | $51,288 | $6,600 | $44,688 |
Source: Public Records
Map
Nearby Homes
- 2219 Travis Rd
- 2264 Basswood Dr
- 4213 Stone Rd
- 4211 Stone Rd
- 307 Suncrest Ct
- 304 Suncrest Ct
- 2104 Travis Rd
- 308 Suncrest Ct
- 323 Suncrest Ct
- 328 Suncrest Ct
- 4104 Short Leaf Ct
- 2348 Fieldcrest Rd
- 2383 Richwood Dr
- 2264 Nellie Dr
- 4304 Parkwood Dr
- 4305 Parkwood Dr
- 4332 Parkwood Dr
- 4349 White Pines Ct
- 2323 Woodsman Dr
- 3346 Thames Place
- 2114 Cassell St
- 2108 Cassell St
- 2112 Cassell St
- 2106 Cassell St
- 2116 Cassell St
- 2107 Boykin Rd
- 2109 Boykin Rd
- 2113 Cassell St
- 2109 Cassell St
- 2111 Cassell St
- 2107 Cassell St
- 2111 Boykin Rd
- 2104 Cassell St
- 2118 Cassell St
- 2115 Cassell St
- 4211 Akard St
- 2113 Boykin Rd
- 2117 Cassell St
- 2102 Cassell St
- 2120 Cassell St
Your Personal Tour Guide
Ask me questions while you tour the home.