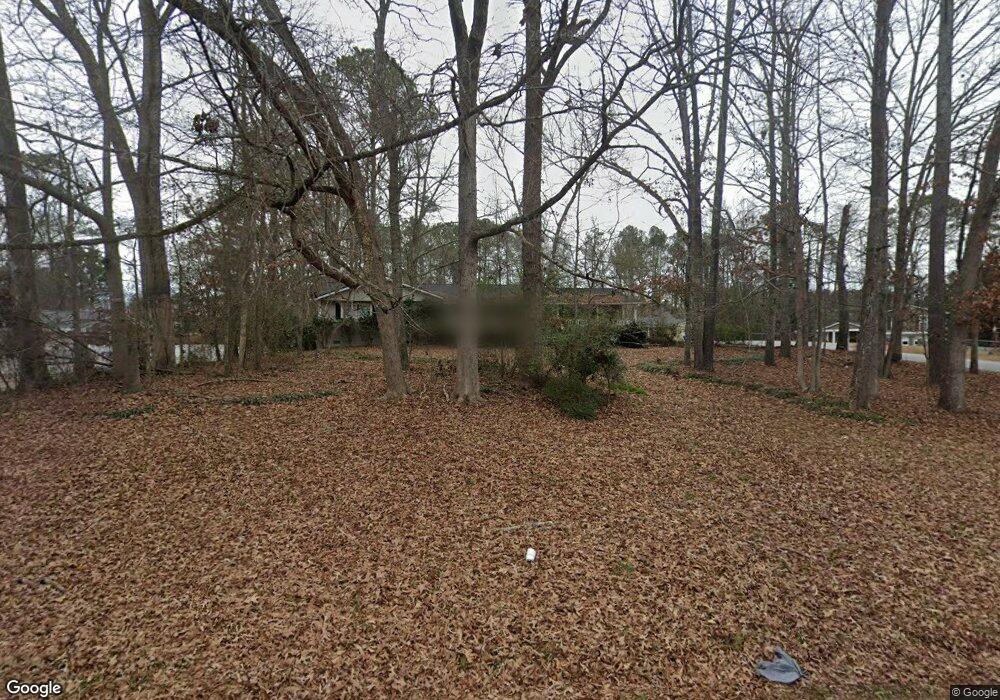
2110 Chestnut Log Dr Lithia Springs, GA 30122
Lithia Springs NeighborhoodEstimated Value: $200,000 - $252,000
5
Beds
3
Baths
1,712
Sq Ft
$133/Sq Ft
Est. Value
About This Home
This home is located at 2110 Chestnut Log Dr, Lithia Springs, GA 30122 and is currently estimated at $228,224, approximately $133 per square foot. 2110 Chestnut Log Dr is a home located in Douglas County with nearby schools including Sweetwater Elementary School, Factory Shoals Middle School, and Lithia Springs Comprehensive High School.
Ownership History
Date
Name
Owned For
Owner Type
Purchase Details
Closed on
Aug 27, 2021
Sold by
A Georgia Llc
Bought by
A Delaware Limited Partnership
Current Estimated Value
Purchase Details
Closed on
Aug 16, 2021
Sold by
Sfr Xii Atl Owner 1 Lp
Bought by
Sfr Xii Atl Owner 2 Lp
Purchase Details
Closed on
Jun 4, 2021
Sold by
Watson Katherine H
Bought by
Watson Kathy H and Watson John A
Purchase Details
Closed on
Aug 3, 2005
Sold by
Watson Katherine H
Bought by
Watson John A and Watson Kathy
Home Financials for this Owner
Home Financials are based on the most recent Mortgage that was taken out on this home.
Original Mortgage
$78,000
Interest Rate
5.51%
Mortgage Type
New Conventional
Purchase Details
Closed on
Jun 6, 1996
Sold by
Kitchen Dorinda
Bought by
Watson Katherine
Create a Home Valuation Report for This Property
The Home Valuation Report is an in-depth analysis detailing your home's value as well as a comparison with similar homes in the area
Home Values in the Area
Average Home Value in this Area
Purchase History
| Date | Buyer | Sale Price | Title Company |
|---|---|---|---|
| A Delaware Limited Partnership | $207,100 | None Listed On Document | |
| Sfr Xii Atl Owner 2 Lp | -- | -- | |
| Watson Kathy H | -- | None Listed On Document | |
| Sfr Xii Atl Owner 1 Lp | $145,000 | -- | |
| Magnolia Residential Of Georgia Llc | $90,000 | -- | |
| Watson John A | -- | -- | |
| Watson Katherine | $57,900 | -- |
Source: Public Records
Mortgage History
| Date | Status | Borrower | Loan Amount |
|---|---|---|---|
| Previous Owner | Watson John A | $78,000 | |
| Closed | Watson Katherine | $0 |
Source: Public Records
Tax History Compared to Growth
Tax History
| Year | Tax Paid | Tax Assessment Tax Assessment Total Assessment is a certain percentage of the fair market value that is determined by local assessors to be the total taxable value of land and additions on the property. | Land | Improvement |
|---|---|---|---|---|
| 2024 | $1,890 | $58,000 | $17,980 | $40,020 |
| 2023 | $1,890 | $58,000 | $17,980 | $40,020 |
| 2022 | $1,742 | $60,600 | $18,000 | $42,600 |
| 2021 | $1,380 | $40,320 | $12,000 | $28,320 |
| 2020 | $1,393 | $40,320 | $12,000 | $28,320 |
| 2019 | $990 | $30,160 | $9,240 | $20,920 |
| 2018 | $856 | $25,720 | $8,040 | $17,680 |
| 2017 | $798 | $23,400 | $8,040 | $15,360 |
| 2016 | $940 | $27,400 | $9,600 | $17,800 |
| 2015 | $833 | $23,560 | $8,520 | $15,040 |
| 2014 | $831 | $23,076 | $8,640 | $14,436 |
| 2013 | -- | $25,600 | $9,600 | $16,000 |
Source: Public Records
Map
Nearby Homes
- 2322 Chestnut Log Loop
- 2275 Chestnut Log Loop
- 1940 Lee
- 2499 Chestnut Log Loop
- 3570 Briar Dr
- 8684 Hickory Ln
- 2087 Chestnut Way
- LOT 27 Chestnut Ln
- 1815 Lee Rd
- 3646 Briar Dr
- 3652 Sweetbriar Cir
- 2344 Mount Vernon Rd
- 3686 Sweetbriar Cir
- 2182 Ann Ln
- 3790 Sweetbriar Cir
- 3460 Meadowview Dr
- HAYDEN Plan at Fairhaven
- GREEN Plan at Fairhaven
- CALI Plan at Fairhaven
- ELLE Plan at Fairhaven
- 2110 Chestnut Log Cir
- 2363 Chestnut Log Dr
- 2096 Chestnut Log Cir
- 2329 Chestnut Log Dr
- 2329 Chestnut Log Dr Unit 4
- 2090 Chestnut Log Cir
- 2356 Chestnut Log Dr
- 2097 Chestnut Log Cir
- 2346 Chestnut Log Dr
- 2373 Chestnut Log Dr
- 2366 Chestnut Log Dr
- 2374 Chestnut Log Ct
- 2336 Chestnut Log Dr
- 2376 Chestnut Log Dr
- 2370 Chestnut Log Ct Unit 4
- 2107 Chestnut Log Dr
- 2376 Chestnut Log Dr
- 2319 Chestnut Log Dr Unit 4
- 2330 Chestnut Log Loop
- 2083 Chestnut Log Dr