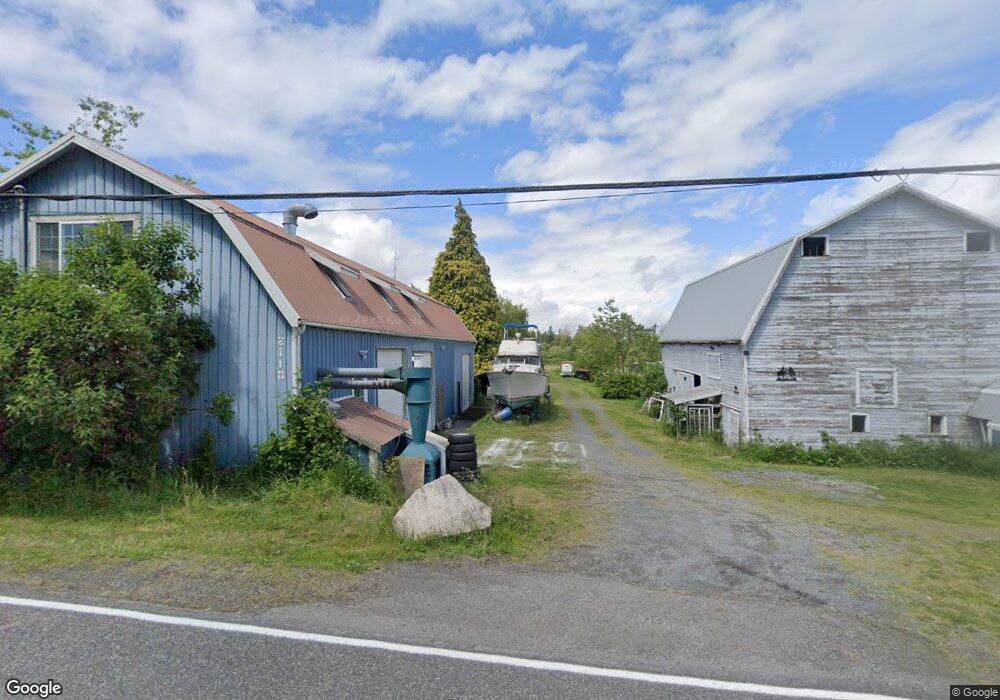
2110 E Hemmi Rd Bellingham, WA 98226
Estimated Value: $829,000 - $1,289,000
3
Beds
2
Baths
2,888
Sq Ft
$341/Sq Ft
Est. Value
About This Home
This home is located at 2110 E Hemmi Rd, Bellingham, WA 98226 and is currently estimated at $985,647, approximately $341 per square foot. 2110 E Hemmi Rd is a home located in Whatcom County with nearby schools including Mount Baker Senior High School.
Ownership History
Date
Name
Owned For
Owner Type
Purchase Details
Closed on
Dec 16, 2020
Sold by
Carlson Cathryn L
Bought by
Carlson Cathryn L and Carlson Kerry A
Current Estimated Value
Purchase Details
Closed on
May 11, 2011
Sold by
Rodgers Marilyn J
Bought by
The Marylin Jean Rodgers Revocable Livin
Purchase Details
Closed on
Jan 26, 2006
Sold by
Carlson Kerry A and Carlson Cathryn L
Bought by
Carlson Kerry A and Carlson Cathryn L
Purchase Details
Closed on
Sep 29, 2000
Sold by
Morelli Juanita J
Bought by
Carlson Kerry A and Carlson Cathryn L
Home Financials for this Owner
Home Financials are based on the most recent Mortgage that was taken out on this home.
Original Mortgage
$178,400
Interest Rate
8.38%
Create a Home Valuation Report for This Property
The Home Valuation Report is an in-depth analysis detailing your home's value as well as a comparison with similar homes in the area
Home Values in the Area
Average Home Value in this Area
Purchase History
| Date | Buyer | Sale Price | Title Company |
|---|---|---|---|
| Carlson Cathryn L | -- | None Available | |
| Carlson Cathryn L | -- | None Available | |
| The Marylin Jean Rodgers Revocable Livin | $336,391 | None Available | |
| Carlson Kerry A | -- | None Available | |
| Carlson Kerry A | $191,679 | Whatcom Land Title |
Source: Public Records
Mortgage History
| Date | Status | Borrower | Loan Amount |
|---|---|---|---|
| Previous Owner | Carlson Kerry A | $178,400 |
Source: Public Records
Tax History Compared to Growth
Tax History
| Year | Tax Paid | Tax Assessment Tax Assessment Total Assessment is a certain percentage of the fair market value that is determined by local assessors to be the total taxable value of land and additions on the property. | Land | Improvement |
|---|---|---|---|---|
| 2024 | $7,434 | $1,022,756 | $274,736 | $748,020 |
| 2023 | $7,434 | $1,030,830 | $373,184 | $657,646 |
| 2022 | $6,504 | $844,923 | $305,882 | $539,041 |
| 2021 | $5,878 | $681,383 | $246,677 | $434,706 |
| 2020 | $5,409 | $577,442 | $209,048 | $368,394 |
| 2019 | $4,827 | $508,768 | $184,186 | $324,582 |
| 2018 | $4,640 | $490,521 | $177,580 | $312,941 |
| 2017 | $4,195 | $368,449 | $153,769 | $214,680 |
| 2016 | $4,035 | $355,656 | $148,430 | $207,226 |
| 2015 | $3,719 | $339,664 | $141,756 | $197,908 |
| 2014 | -- | $319,834 | $133,480 | $186,354 |
| 2013 | -- | $319,834 | $133,480 | $186,354 |
Source: Public Records
Map
Nearby Homes
- 6068 E Hemmi Ln
- 5818 Everson Goshen Rd
- 2403 E Hemmi Rd
- 5975 Hoag Ln
- 2529 E Hemmi Rd
- 1817 Central Rd
- 0 E 66th Terrace
- 2268 Childers Rd
- 2200 E Smith Rd
- 5539 Noon Rd
- 1383 Ten Mile Rd
- 2571 E Smith Rd
- 1891 E Smith Rd
- 2460 E Pole Rd
- 1822 E Pole Rd
- 5544 Sand Rd
- 800 Cedar Dr
- 205 Sable Dr
- 1307 Birchwood Dr
- 5196 Sand Rd
- 6097 Everson Goshen Rd
- 2070 E Hemmi Rd
- 6155 Everson Goshen Rd
- 6160 Everson Goshen Rd
- 2142 E Hemmi Rd
- 2066 E Hemmi Rd
- 2152 E Hemmi Rd
- 6058 Everson Goshen Rd
- 2065 E Hemmi Rd
- 2040 E Hemmi Rd
- 2180 E Hemmi Rd
- 2034 E Hemmi Rd
- 2025 E Hemmi Rd
- 6222 Everson Goshen Rd
- 6035 Everson Goshen Rd
- 2214 E Hemmi Rd
- 2011 E Hemmi Rd
- 2211 E Hemmi Rd
- 6211 Everson Goshen Rd
- 5989 Everson Goshen Rd