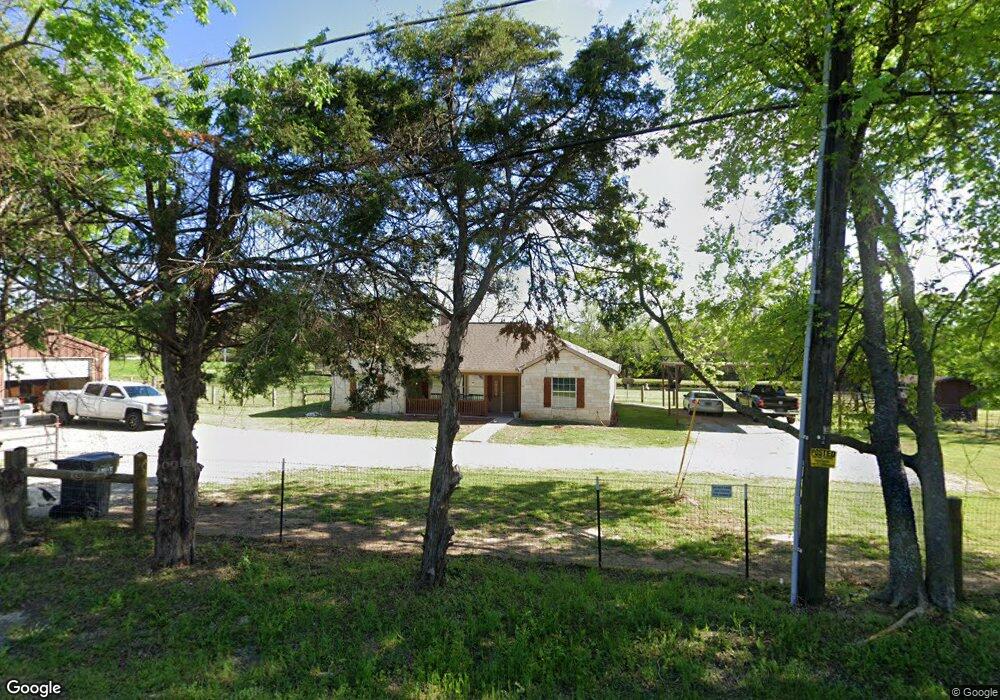
2110 E Texas St Denison, TX 75021
Estimated Value: $331,000 - $340,385
3
Beds
2
Baths
1,589
Sq Ft
$211/Sq Ft
Est. Value
About This Home
This home is located at 2110 E Texas St, Denison, TX 75021 and is currently estimated at $335,693, approximately $211 per square foot. 2110 E Texas St is a home located in Grayson County with nearby schools including Lamar Elementary School, Scott Middle School, and Denison High School.
Ownership History
Date
Name
Owned For
Owner Type
Purchase Details
Closed on
Aug 9, 2022
Sold by
Hoard Beverly S
Bought by
Hoard Bonnie Sue and Elkins Bobbie Lois
Current Estimated Value
Purchase Details
Closed on
Sep 24, 2020
Sold by
Davis Eric Charles and Davis Anna M
Bought by
Campbell Michael Shane and Campbell Francis
Home Financials for this Owner
Home Financials are based on the most recent Mortgage that was taken out on this home.
Original Mortgage
$175,920
Interest Rate
2.9%
Mortgage Type
New Conventional
Purchase Details
Closed on
Jun 25, 2020
Sold by
Hoard Thomas H and Hoard Thomas Howard
Bought by
Davis Eric Charles and Davis Anna M
Home Financials for this Owner
Home Financials are based on the most recent Mortgage that was taken out on this home.
Original Mortgage
$184,594
Interest Rate
3.2%
Mortgage Type
FHA
Create a Home Valuation Report for This Property
The Home Valuation Report is an in-depth analysis detailing your home's value as well as a comparison with similar homes in the area
Home Values in the Area
Average Home Value in this Area
Purchase History
| Date | Buyer | Sale Price | Title Company |
|---|---|---|---|
| Hoard Bonnie Sue | -- | New Title Company Name | |
| Campbell Michael Shane | -- | Rtt | |
| Davis Eric Charles | -- | Rtt |
Source: Public Records
Mortgage History
| Date | Status | Borrower | Loan Amount |
|---|---|---|---|
| Previous Owner | Campbell Michael Shane | $175,920 | |
| Previous Owner | Davis Eric Charles | $184,594 |
Source: Public Records
Tax History
| Year | Tax Paid | Tax Assessment Tax Assessment Total Assessment is a certain percentage of the fair market value that is determined by local assessors to be the total taxable value of land and additions on the property. | Land | Improvement |
|---|---|---|---|---|
| 2025 | $3,922 | $331,040 | $87,349 | $243,691 |
| 2024 | $5,282 | $327,044 | $83,560 | $243,484 |
| 2023 | $3,525 | $302,883 | $0 | $0 |
| 2022 | $4,577 | $264,870 | $0 | $0 |
| 2021 | $3,902 | $208,104 | $41,649 | $166,455 |
| 2020 | $3,850 | $193,401 | $24,890 | $168,511 |
| 2019 | $3,878 | $194,609 | $24,501 | $170,108 |
| 2018 | $3,563 | $165,986 | $20,734 | $145,252 |
| 2017 | $3,442 | $159,320 | $21,253 | $138,067 |
| 2016 | $373 | $17,252 | $17,252 | $0 |
Source: Public Records
Map
Nearby Homes
- 54 Doty Ln
- 492 Richerson Rd
- 1534 E Texas St
- 417 E Texas St
- TBD E Texas St
- 1382 US Highway 69
- TBD N Highway 69
- 732 E Bullock St
- 721 E Bullock St
- 5.92 Rd
- 621 E Murray St
- 705 E Hanna St
- 622 E Heron St
- 625 E Acheson St
- 718 E Crawford St
- 609 E Monterey St
- 616 E Shepherd St
- 607 E Monterey St
- 608 E Shepherd St
- 21 Chaparral Estates Dr
- 2080 E Texas St
- 996 Fm 1753
- 2030 E Texas St
- 2045 E Texas St
- 86 Richerson Rd
- 000 Richerson Rd
- 0 Richerson Rd
- 2004 E Texas St
- 839 Fm 1753
- 1979 E Texas St
- 654 Old Airport Rd
- 680 Old Airport Rd
- A-G0787 Fm 1753
- 1084 Fm 1753
- 1087 Fm 1753
- 1939 E Texas St
- 188 Richerson Rd
- 699 Old Airport Rd
- 601 Old Airport Rd
- 553 Old Airport Rd