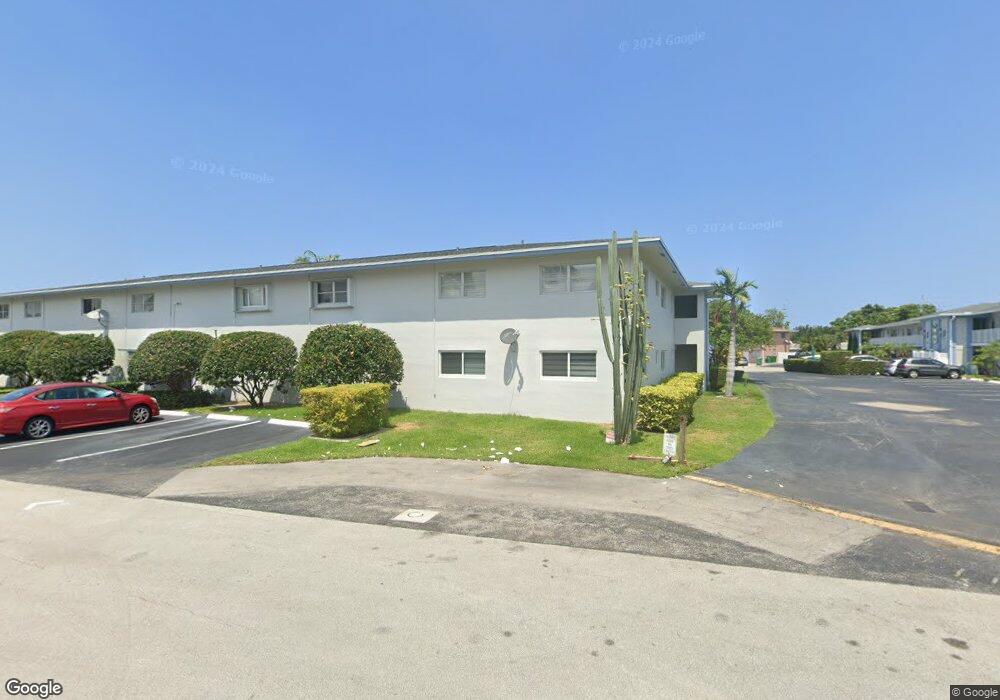
2110 NE 42nd St Unit 5B Lighthouse Point, FL 33064
Estimated Value: $185,589 - $261,000
2
Beds
2
Baths
960
Sq Ft
$217/Sq Ft
Est. Value
About This Home
This home is located at 2110 NE 42nd St Unit 5B, Lighthouse Point, FL 33064 and is currently estimated at $208,647, approximately $217 per square foot. 2110 NE 42nd St Unit 5B is a home located in Broward County with nearby schools including Norcrest Elementary School, Deerfield Beach Middle School, and Deerfield Beach High School.
Ownership History
Date
Name
Owned For
Owner Type
Purchase Details
Closed on
Sep 21, 2022
Sold by
Charles Re
Bought by
Aviles Renato G
Current Estimated Value
Purchase Details
Closed on
Nov 13, 2019
Sold by
Wright Carol R and Carol R Wright Trust
Bought by
Re Charles
Purchase Details
Closed on
Nov 18, 2008
Sold by
Wright Carol
Bought by
Wright Carol
Purchase Details
Closed on
Apr 29, 1999
Sold by
Wilcox Joseph C and Wilcox Michael
Bought by
Wright Carol
Home Financials for this Owner
Home Financials are based on the most recent Mortgage that was taken out on this home.
Original Mortgage
$44,743
Interest Rate
7.06%
Mortgage Type
New Conventional
Purchase Details
Closed on
Sep 2, 1998
Sold by
Pr Michael Wilcox
Bought by
Wilcox Joseph C and Wilcox Michael
Purchase Details
Closed on
Mar 31, 1995
Sold by
Friend Donald E and Friend Eleanor E
Bought by
Wilcox Elizabeth
Create a Home Valuation Report for This Property
The Home Valuation Report is an in-depth analysis detailing your home's value as well as a comparison with similar homes in the area
Home Values in the Area
Average Home Value in this Area
Purchase History
| Date | Buyer | Sale Price | Title Company |
|---|---|---|---|
| Aviles Renato G | $220,000 | -- | |
| Re Charles | $119,000 | Attorney | |
| Wright Carol | -- | Attorney | |
| Wright Carol | $49,800 | -- | |
| Wilcox Joseph C | $100 | -- | |
| Wilcox Elizabeth | $45,000 | -- |
Source: Public Records
Mortgage History
| Date | Status | Borrower | Loan Amount |
|---|---|---|---|
| Previous Owner | Wilcox Joseph C | $44,743 |
Source: Public Records
Tax History
| Year | Tax Paid | Tax Assessment Tax Assessment Total Assessment is a certain percentage of the fair market value that is determined by local assessors to be the total taxable value of land and additions on the property. | Land | Improvement |
|---|---|---|---|---|
| 2026 | $4,588 | $199,220 | $19,920 | $179,300 |
| 2025 | $4,166 | $175,670 | $17,570 | $158,100 |
| 2024 | $4,166 | $175,670 | $17,570 | $158,100 |
| 2023 | $4,166 | $174,930 | $17,490 | $157,440 |
| 2022 | $1,732 | $99,580 | $0 | $0 |
| 2021 | $1,677 | $96,680 | $9,670 | $87,010 |
| 2020 | $2,393 | $97,720 | $9,770 | $87,950 |
| 2019 | $805 | $37,060 | $0 | $0 |
| 2018 | $769 | $36,370 | $0 | $0 |
| 2017 | $570 | $35,630 | $0 | $0 |
| 2016 | $632 | $34,900 | $0 | $0 |
| 2015 | $288 | $34,660 | $0 | $0 |
| 2014 | $286 | $34,390 | $0 | $0 |
| 2013 | -- | $36,760 | $3,680 | $33,080 |
Source: Public Records
Map
Nearby Homes
- 2337 Vintage Dr
- 2329 Vintage Dr
- 2318 Vintage Dr
- 2131 NE 40th Ct
- 4141 NE 22nd Terrace
- 2317 Vintage Dr
- 2131 NE 42nd Ct Unit 208E
- 2131 NE 42nd Ct Unit 104E
- 2131 NE 42nd Ct Unit 211E
- 2131 NE 42nd Ct Unit 106E
- 2131 NE 42nd Ct Unit 210E
- 2115 NE 42nd Ct Unit 104N
- 2131 NE 42nd Ct Unit 202E
- 2131 NE 42nd Ct Unit 209E
- 2344 Vintage Dr
- 2161 NE 42nd Ct Unit 114
- 2161 NE 42nd Ct Unit 215
- 3900 NE 22nd Ave
- 2151 NE 42nd Ct Unit 237E
- 2151 NE 42nd Ct Unit 136
- 2110 NE 42nd St Unit A
- 2110 NE 42nd St Unit B
- 2110 NE 42nd St Unit 8
- 2120 NE 42nd St Unit B
- 2120 NE 42nd St Unit 4
- 2120 NE 42nd St Unit A
- 2120 NE 42nd St Unit 1
- 2120 NE 42nd St Unit F
- 2120 NE 42nd St Unit E
- 2120 NE 42nd St Unit 5
- 2120 NE 42nd St Unit 3
- 2120 NE 42nd St Unit C
- 2120 NE 42nd St Unit D
- 2120 NE 42nd St Unit A6
- 2110 NE 42nd St Unit 3B
- 2110 NE 42nd St Unit 9B
- 2110 NE 42nd St Unit 11B
- 2110 NE 42nd St Unit 7B
- 2110 NE 42nd St Unit 10B
- 2110 NE 42nd St Unit 2B
Your Personal Tour Guide
Ask me questions while you tour the home.