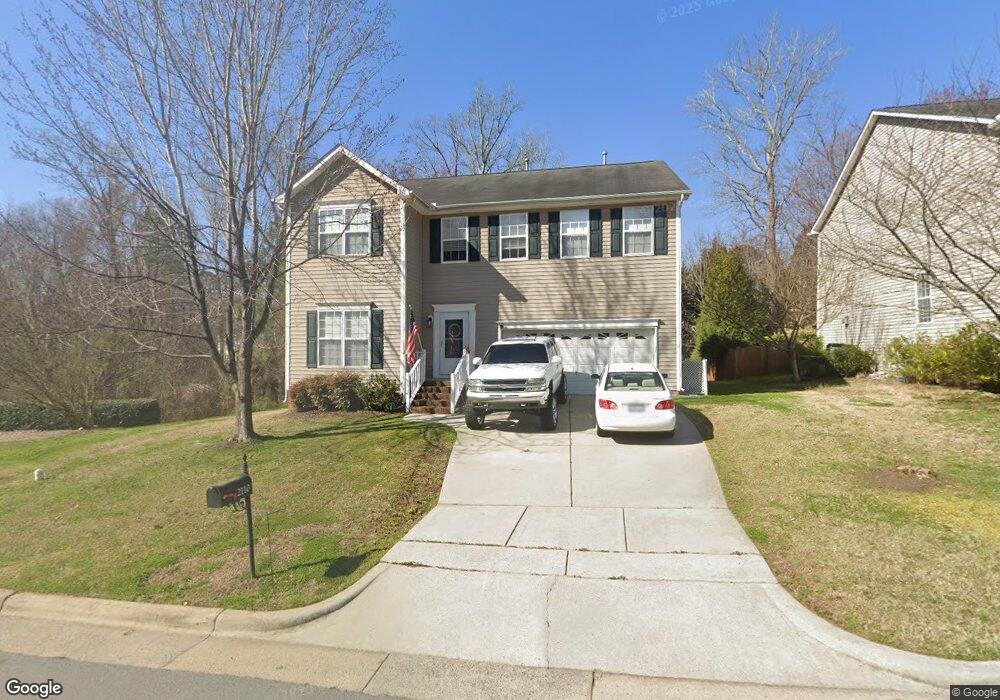
2110 Pilot Mountain Ct Apex, NC 27502
West Apex NeighborhoodEstimated Value: $620,000 - $710,000
--
Bed
3
Baths
3,076
Sq Ft
$217/Sq Ft
Est. Value
About This Home
This home is located at 2110 Pilot Mountain Ct, Apex, NC 27502 and is currently estimated at $666,967, approximately $216 per square foot. 2110 Pilot Mountain Ct is a home located in Wake County with nearby schools including Scotts Ridge Elementary School, Apex Friendship Middle School, and Apex Friendship High School.
Ownership History
Date
Name
Owned For
Owner Type
Purchase Details
Closed on
Feb 7, 2020
Sold by
Sussman Dayna Lynn and Euto Dayna
Bought by
Sussman Dayna Lynn
Current Estimated Value
Home Financials for this Owner
Home Financials are based on the most recent Mortgage that was taken out on this home.
Original Mortgage
$260,000
Outstanding Balance
$230,735
Interest Rate
3.72%
Mortgage Type
New Conventional
Estimated Equity
$436,232
Purchase Details
Closed on
Jul 31, 2009
Sold by
Futo Steven
Bought by
Futo Dayna
Purchase Details
Closed on
Nov 4, 2004
Sold by
The New Fortis Corp
Bought by
Futo Steven Joe and Futo Dayna Lynn
Home Financials for this Owner
Home Financials are based on the most recent Mortgage that was taken out on this home.
Original Mortgage
$214,919
Interest Rate
5.5%
Mortgage Type
Purchase Money Mortgage
Create a Home Valuation Report for This Property
The Home Valuation Report is an in-depth analysis detailing your home's value as well as a comparison with similar homes in the area
Home Values in the Area
Average Home Value in this Area
Purchase History
| Date | Buyer | Sale Price | Title Company |
|---|---|---|---|
| Sussman Dayna Lynn | -- | None Available | |
| Futo Dayna | -- | None Available | |
| Futo Steven Joe | $215,000 | -- |
Source: Public Records
Mortgage History
| Date | Status | Borrower | Loan Amount |
|---|---|---|---|
| Open | Sussman Dayna Lynn | $260,000 | |
| Closed | Futo Steven Joe | $214,919 |
Source: Public Records
Tax History Compared to Growth
Tax History
| Year | Tax Paid | Tax Assessment Tax Assessment Total Assessment is a certain percentage of the fair market value that is determined by local assessors to be the total taxable value of land and additions on the property. | Land | Improvement |
|---|---|---|---|---|
| 2025 | $5,104 | $582,298 | $145,000 | $437,298 |
| 2024 | $4,990 | $582,298 | $145,000 | $437,298 |
| 2023 | $4,243 | $384,976 | $85,000 | $299,976 |
| 2022 | $3,983 | $384,976 | $85,000 | $299,976 |
| 2021 | $3,831 | $384,976 | $85,000 | $299,976 |
| 2020 | $3,793 | $384,976 | $85,000 | $299,976 |
| 2019 | $3,536 | $309,546 | $80,000 | $229,546 |
| 2018 | $3,330 | $309,546 | $80,000 | $229,546 |
| 2017 | $3,100 | $309,546 | $80,000 | $229,546 |
| 2016 | $3,055 | $309,546 | $80,000 | $229,546 |
| 2015 | $3,017 | $298,389 | $48,000 | $250,389 |
| 2014 | $2,908 | $298,389 | $48,000 | $250,389 |
Source: Public Records
Map
Nearby Homes
- 2006 Jerimouth Dr
- 1124 Woodlands Creek Way
- 1126 Woodlands Creek Way
- 2108 Jerimouth Dr
- 2006 Driskill Ct
- 2129 Kelly Rd
- 7104 Camp Branch Ln
- 2022 Van Hook Ln
- 1042 Mica Lamp Ct
- 1952 Combine Cir
- 2011 Becca Ct
- 2006 Leo Dr
- 505 Brickstone Dr
- 1726 Barrett Run Trail
- 1701 Barrett Run Trail
- 1897 Lazio Ln
- 1809 Barrett Run Trail
- 109 Kinship Ln
- 312 Brierridge Dr
- 1512 Piazzo Ct
- 2108 Pilot Mountain Ct
- 2309 Brasstown Ln
- 2307 Brasstown Ln
- 2106 Pilot Mountain Ct
- 2305 Brasstown Ln
- 2311 Brasstown Ln
- 2104 Pilot Mountain Ct
- 2107 Pilot Mountain Ct
- 2111 Pilot Mountain Ct
- 2116 Pilot Mountain Ct
- 2303 Brasstown Ln
- 2113 Pilot Mountain Ct
- 2313 Brasstown Ln
- 2105 Pilot Mountain Ct
- 2102 Pilot Mountain Ct
- 2115 Pilot Mountain Ct
- 2308 Brasstown Ln
- 2118 Pilot Mountain Ct
- 2301 Brasstown Ln
- 2306 Brasstown Ln