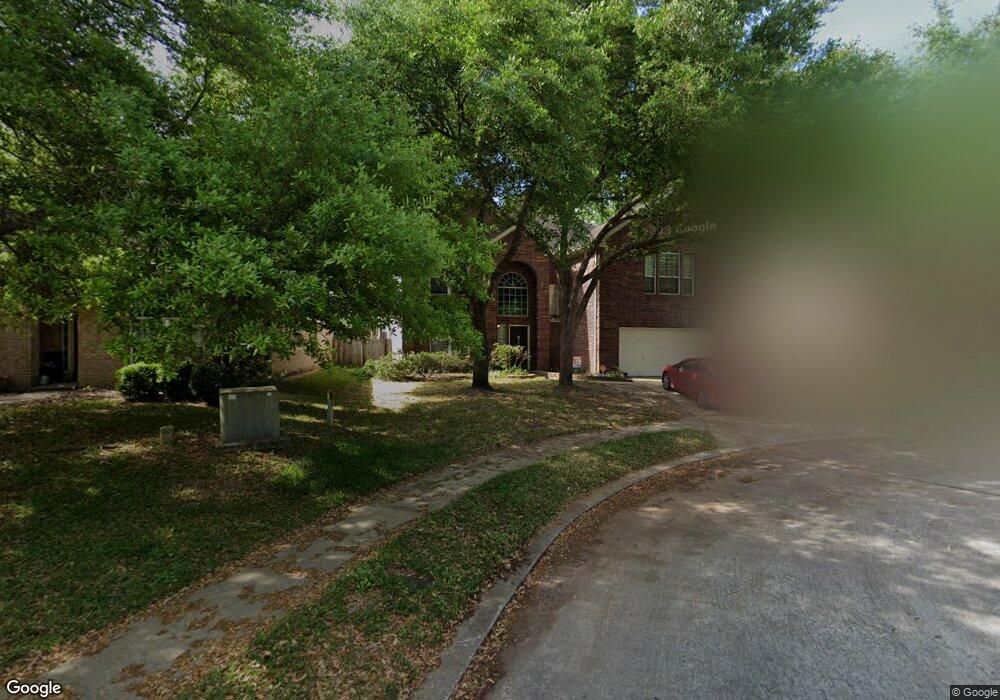
2110 Stoneycreek Park Conroe, TX 77385
Imperial Oaks NeighborhoodEstimated Value: $409,000 - $453,228
--
Bed
3
Baths
3,287
Sq Ft
$130/Sq Ft
Est. Value
About This Home
This home is located at 2110 Stoneycreek Park, Conroe, TX 77385 and is currently estimated at $428,057, approximately $130 per square foot. 2110 Stoneycreek Park is a home located in Montgomery County with nearby schools including Kaufman Elementary School, Vogel Intermediate School, and Irons J High School.
Ownership History
Date
Name
Owned For
Owner Type
Purchase Details
Closed on
Jul 27, 2017
Sold by
Conerly T Rod and Conerly Lidia Y
Bought by
Howard Johnathan and Howard Shasta
Current Estimated Value
Home Financials for this Owner
Home Financials are based on the most recent Mortgage that was taken out on this home.
Original Mortgage
$233,910
Outstanding Balance
$194,916
Interest Rate
3.91%
Mortgage Type
New Conventional
Estimated Equity
$233,141
Purchase Details
Closed on
Oct 6, 2009
Sold by
Dean Dannette and Dean Edward
Bought by
The Bank Of New York Mellon
Purchase Details
Closed on
Jul 12, 2002
Sold by
Beazer Homes Texas Lp
Bought by
Conerly T Rod and Conerly Lidia Y
Home Financials for this Owner
Home Financials are based on the most recent Mortgage that was taken out on this home.
Original Mortgage
$151,900
Interest Rate
6.73%
Purchase Details
Closed on
Nov 15, 2001
Sold by
Imperial Oaks Joint Venture
Bought by
Conerly Conerly T and Conerly Lidia
Create a Home Valuation Report for This Property
The Home Valuation Report is an in-depth analysis detailing your home's value as well as a comparison with similar homes in the area
Home Values in the Area
Average Home Value in this Area
Purchase History
| Date | Buyer | Sale Price | Title Company |
|---|---|---|---|
| Howard Johnathan | -- | Chicago Title | |
| The Bank Of New York Mellon | $148,750 | None Available | |
| Conerly T Rod | -- | Texas Lone Star Title Lp | |
| Conerly Conerly T | -- | -- |
Source: Public Records
Mortgage History
| Date | Status | Borrower | Loan Amount |
|---|---|---|---|
| Open | Howard Johnathan | $233,910 | |
| Previous Owner | Conerly T Rod | $151,900 |
Source: Public Records
Tax History Compared to Growth
Tax History
| Year | Tax Paid | Tax Assessment Tax Assessment Total Assessment is a certain percentage of the fair market value that is determined by local assessors to be the total taxable value of land and additions on the property. | Land | Improvement |
|---|---|---|---|---|
| 2025 | $9,256 | $432,050 | $58,000 | $374,050 |
| 2024 | $8,267 | $439,389 | $58,000 | $381,389 |
| 2023 | $8,267 | $393,140 | $58,000 | $335,140 |
| 2022 | $8,777 | $380,600 | $13,790 | $366,810 |
| 2021 | $7,592 | $305,800 | $13,790 | $292,010 |
| 2020 | $6,734 | $260,570 | $13,790 | $246,780 |
| 2019 | $7,021 | $278,110 | $13,790 | $264,320 |
| 2018 | $6,914 | $259,480 | $13,790 | $245,690 |
| 2017 | $6,903 | $254,560 | $13,790 | $240,770 |
| 2016 | $6,654 | $245,400 | $13,790 | $240,770 |
| 2015 | $5,361 | $223,090 | $13,790 | $240,770 |
| 2014 | $5,361 | $202,810 | $13,790 | $212,110 |
Source: Public Records
Map
Nearby Homes
- 2103 Winding Hollow Ct
- 22941 Antiqua Estates Ct
- 32319 Archer Park
- 2611 Winding Creek Way
- 2614 Winding Creek Way
- 32331 Summer Park Ln
- 32315 Golden Oak Park Ln
- 2623 Cedar Path Ln
- 2611 Cedar Path Ln
- 2610 Cedar Path Ln
- 2645 Ivy Wood Ln
- 2526 Hidden Park Ln
- 2143 Westover Park Cir
- 2626 Ivy Wood Ln
- 2754 Hidden Hollow Ln
- 2606 Ivy Wood Ln
- 10940 Longleaf Dr
- 31903 Burnt Wood Ct
- 2707 Oak Pass Ct
- 31602 Forest Oak Park Ct
- 2114 Stoneycreek Park
- 2106 Stoneycreek Park
- 31823 Midlake Park
- 31827 Midlake Park
- 31819 Midlake Park
- 2102 Stoneycreek Park
- 31831 Midlake Park
- 31815 Midlake Park
- 2126 Stoneycreek Park
- 2111 Stoneycreek Park
- 2115 Stoneycreek Park
- 2107 Stoneycreek Park
- 2111 Stoneycreek Park Ct
- 31811 Midlake Park
- 2119 Stoneycreek Park
- 31807 Midlake Park
- 2123 Stoneycreek Park Ct
- 2123 Stoneycreek Park
- 31822 Midlake Park
- 31818 Midlake Park