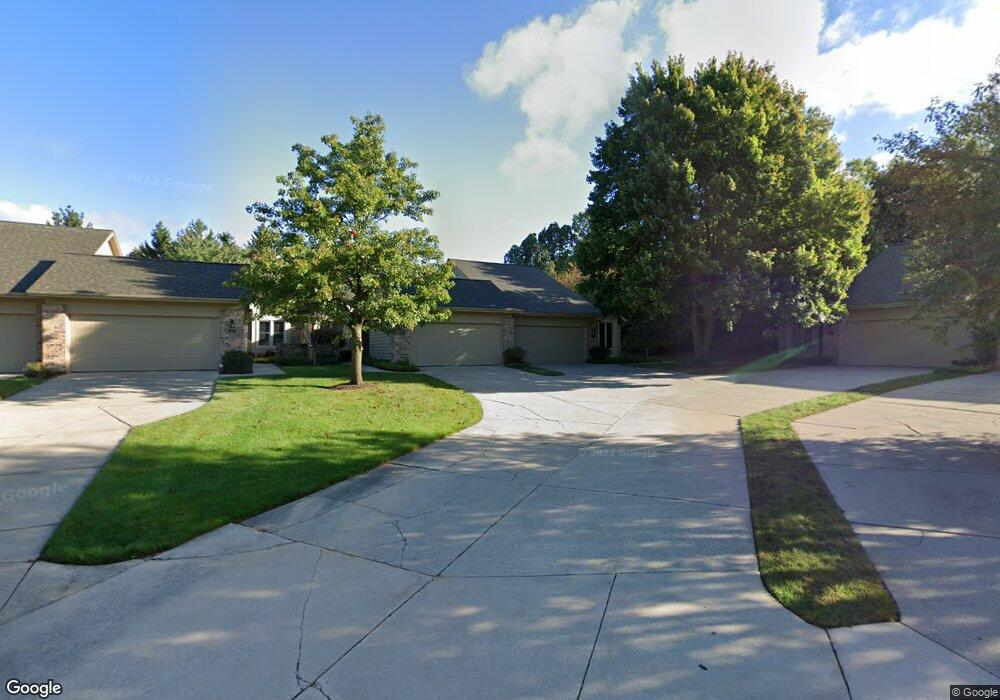
2110 Tall Meadow St NE Unit 29 Grand Rapids, MI 49505
Creston NeighborhoodEstimated Value: $336,000 - $379,000
2
Beds
3
Baths
2,090
Sq Ft
$170/Sq Ft
Est. Value
About This Home
This home is located at 2110 Tall Meadow St NE Unit 29, Grand Rapids, MI 49505 and is currently estimated at $356,151, approximately $170 per square foot. 2110 Tall Meadow St NE Unit 29 is a home located in Kent County with nearby schools including Riverside Middle School, Union High School, and Knapp Charter Academy.
Ownership History
Date
Name
Owned For
Owner Type
Purchase Details
Closed on
Feb 1, 2024
Sold by
Barber Colleen
Bought by
Barber Colleen K
Current Estimated Value
Purchase Details
Closed on
Dec 7, 2023
Sold by
Barber Colleen
Bought by
Barber Colleen
Purchase Details
Closed on
Jul 28, 2008
Sold by
Crankshaw John R and Crankshaw Drella M
Bought by
Barber Colleen K
Home Financials for this Owner
Home Financials are based on the most recent Mortgage that was taken out on this home.
Original Mortgage
$100,000
Interest Rate
6.51%
Mortgage Type
Purchase Money Mortgage
Purchase Details
Closed on
Oct 22, 1998
Sold by
Tlbrt Es
Bought by
Crankshaw Crankshaw J and Crankshaw D
Purchase Details
Closed on
May 18, 1995
Sold by
White White W W and White Tolbert F
Bought by
Tolbert Frederick M and Barber Colleen K
Purchase Details
Closed on
Aug 28, 1991
Sold by
Wyndham Dev and Wyndham White W
Bought by
Barber Colleen K
Create a Home Valuation Report for This Property
The Home Valuation Report is an in-depth analysis detailing your home's value as well as a comparison with similar homes in the area
Home Values in the Area
Average Home Value in this Area
Purchase History
| Date | Buyer | Sale Price | Title Company |
|---|---|---|---|
| Barber Colleen K | -- | None Listed On Document | |
| Barber Colleen | -- | Sun Title | |
| Barber Colleen K | $159,900 | None Available | |
| Crankshaw Crankshaw J | $157,000 | -- | |
| Tolbert Frederick M | $145,000 | -- | |
| Barber Colleen K | $136,000 | -- |
Source: Public Records
Mortgage History
| Date | Status | Borrower | Loan Amount |
|---|---|---|---|
| Previous Owner | Barber Colleen K | $100,000 |
Source: Public Records
Tax History Compared to Growth
Tax History
| Year | Tax Paid | Tax Assessment Tax Assessment Total Assessment is a certain percentage of the fair market value that is determined by local assessors to be the total taxable value of land and additions on the property. | Land | Improvement |
|---|---|---|---|---|
| 2025 | $2,588 | $156,600 | $0 | $0 |
| 2024 | $2,588 | $150,400 | $0 | $0 |
| 2023 | $2,479 | $127,100 | $0 | $0 |
| 2022 | $2,493 | $122,800 | $0 | $0 |
| 2021 | $2,437 | $121,700 | $0 | $0 |
| 2020 | $2,330 | $115,400 | $0 | $0 |
| 2019 | $2,440 | $104,500 | $0 | $0 |
| 2018 | $2,356 | $95,800 | $0 | $0 |
| 2017 | $2,294 | $79,900 | $0 | $0 |
| 2016 | $2,322 | $76,700 | $0 | $0 |
| 2015 | $2,159 | $76,700 | $0 | $0 |
| 2013 | -- | $63,500 | $0 | $0 |
Source: Public Records
Map
Nearby Homes
- 2037 Tall Meadow St NE Unit 13
- 2016 Tall Meadow St NE
- 2058 Ken Ade St NE Unit 147
- 2041 Krislin St
- 2268 Thistledowne Dr NE
- 1759 Briarcliff Dr NE
- 2112 Jo Dean Ct NE
- 2753 Dean Lake Ave NE
- 2324 Whimbrel Ct NE
- 2420 Hylane Ct NE
- 1600 Cherry Hill Dr NE
- 2027 Joan Ave NE
- 1739 Waldorn Ave NE
- 1335 Knapp St NE
- 2151 Chelsea Rd NE
- 1524 Sweet St NE
- 2100 Dawson Ave NE
- 2833 Aldale Dr NE
- 1666 Carlton Ave NE
- 1444 Sweet St NE
- 2112 Tall Meadow St NE
- 2108 Tall Meadow St NE Unit 28
- 2114 Tall Meadow St NE
- 2106 Tall Meadow St NE
- 2116 Tall Meadow St NE Unit 32
- 2104 Tall Meadow St NE
- 2102 Tall Meadow St NE Unit 25
- 1946 Cross Bend St NE
- 2047 Tall Meadow St NE Unit 21
- 1944 Cross Bend St NE
- 1942 Cross Bend St NE Unit 34
- 2046 Tall Meadow St NE Unit 20
- 2046 Tall Meadow St NE Unit 52
- 1950 Cross Bend St NE
- 2217 Mapleton St NE
- 2217 Mapleton St NE Unit 131
- 2215 Mapleton St NE
- 2215 Mapleton St NE Unit B2
- 2215 Mapleton St NE Unit 132
- 2213 Mapleton St NE