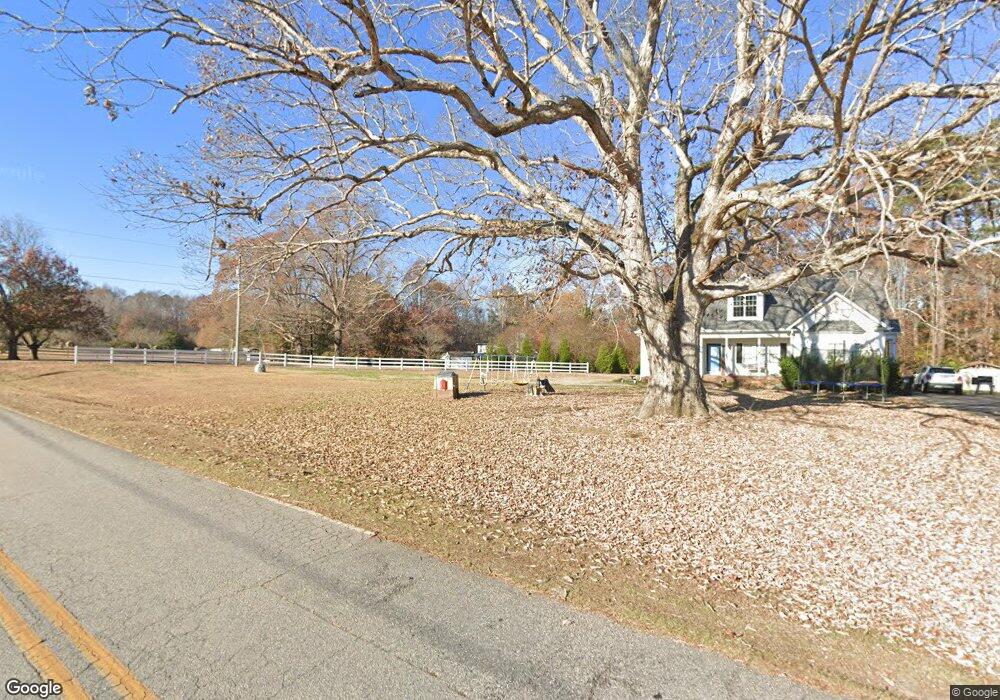
2110 Twin Acres Rd Clayton, NC 27520
Estimated Value: $272,000 - $335,118
3
Beds
3
Baths
1,546
Sq Ft
$203/Sq Ft
Est. Value
About This Home
This home is located at 2110 Twin Acres Rd, Clayton, NC 27520 and is currently estimated at $313,530, approximately $202 per square foot. 2110 Twin Acres Rd is a home located in Johnston County with nearby schools including Polenta Elementary School, Swift Creek Middle, and Cleveland High School.
Ownership History
Date
Name
Owned For
Owner Type
Purchase Details
Closed on
Aug 10, 2020
Sold by
Dunning Nathaniel David and Dunning Sarah Rochelle
Bought by
Cheston Clary O Henry and Cheston Laura Yvette
Current Estimated Value
Home Financials for this Owner
Home Financials are based on the most recent Mortgage that was taken out on this home.
Original Mortgage
$145,600
Outstanding Balance
$129,157
Interest Rate
3%
Mortgage Type
New Conventional
Estimated Equity
$184,373
Purchase Details
Closed on
Jul 20, 2017
Sold by
Huffman Linda Sue
Bought by
Dunning Nathaniel David and Dunning Sarah Rochelle
Home Financials for this Owner
Home Financials are based on the most recent Mortgage that was taken out on this home.
Original Mortgage
$171,830
Interest Rate
4.4%
Mortgage Type
FHA
Purchase Details
Closed on
Mar 28, 2012
Sold by
Huffman Linda Sue
Bought by
Amos Billie B
Create a Home Valuation Report for This Property
The Home Valuation Report is an in-depth analysis detailing your home's value as well as a comparison with similar homes in the area
Home Values in the Area
Average Home Value in this Area
Purchase History
| Date | Buyer | Sale Price | Title Company |
|---|---|---|---|
| Cheston Clary O Henry | $208,000 | None Available | |
| Dunning Nathaniel David | $175,000 | None Available | |
| Amos Billie B | $131,000 | -- |
Source: Public Records
Mortgage History
| Date | Status | Borrower | Loan Amount |
|---|---|---|---|
| Open | Cheston Clary O Henry | $145,600 | |
| Previous Owner | Dunning Nathaniel David | $171,830 |
Source: Public Records
Tax History Compared to Growth
Tax History
| Year | Tax Paid | Tax Assessment Tax Assessment Total Assessment is a certain percentage of the fair market value that is determined by local assessors to be the total taxable value of land and additions on the property. | Land | Improvement |
|---|---|---|---|---|
| 2025 | $1,887 | $297,170 | $73,140 | $224,030 |
| 2024 | $1,352 | $166,940 | $35,110 | $131,830 |
| 2023 | $1,402 | $166,940 | $35,110 | $131,830 |
| 2022 | $1,415 | $166,940 | $35,110 | $131,830 |
| 2021 | $1,415 | $166,940 | $35,110 | $131,830 |
| 2020 | $1,465 | $166,940 | $35,110 | $131,830 |
| 2019 | $1,465 | $166,940 | $35,110 | $131,830 |
| 2018 | $1,215 | $135,390 | $26,330 | $109,060 |
| 2017 | $1,184 | $131,920 | $26,330 | $105,590 |
| 2016 | $1,158 | $131,920 | $26,330 | $105,590 |
| 2015 | -- | $131,920 | $26,330 | $105,590 |
| 2014 | -- | $131,920 | $26,330 | $105,590 |
Source: Public Records
Map
Nearby Homes
- 102 Canyon Rd
- 2600 Jack Rd
- 109 Bronco Pace Dr
- 79 Bronco Pace Dr
- 95 Bronco Pace Dr
- 104 S Nikol Way
- 12649 U S Route 70
- 797 Ranch Rd
- 2239 Barber Mill Rd
- 2124 Lee St
- 37 W Cannalily Ln
- 214 Thumper Way
- 416 Hunter Way
- 350 Big Pine Rd
- 418 Averasboro Dr
- 577 Corbett Rd
- 112 Kelly Ln
- 283 Averasboro Dr
- 254 Dungannon Loop
- 507 Dungannon Loop
- 2096 Twin Acres Rd
- 2347 Twin Acres Rd
- 2085 Twin Acres Rd
- 2100 Twin Acres Rd
- 2090 Twin Acres Rd
- 2095 Twin Acres Rd
- 2075 Twin Acres Rd
- 2120 Twin Acres Rd
- 2130 Twin Acres Rd
- 2101 Twin Acres Rd
- 0 Twin Acres Rd Unit 442905
- 0 Twin Acres Rd Unit 2092332
- 0 Twin Acres Rd Unit 1664601
- 0 Twin Acres Rd Unit 549493
- 0 Twin Acres Rd Unit 10 lots TR1664601
- 0 Twin Acres Rd Unit 2003122
- 0 Twin Acres Rd Unit Twin Acres Road
- 2040 Twin Acres Rd
- 2201 Twin Acres Rd
- 2045 Twin Acres Rd