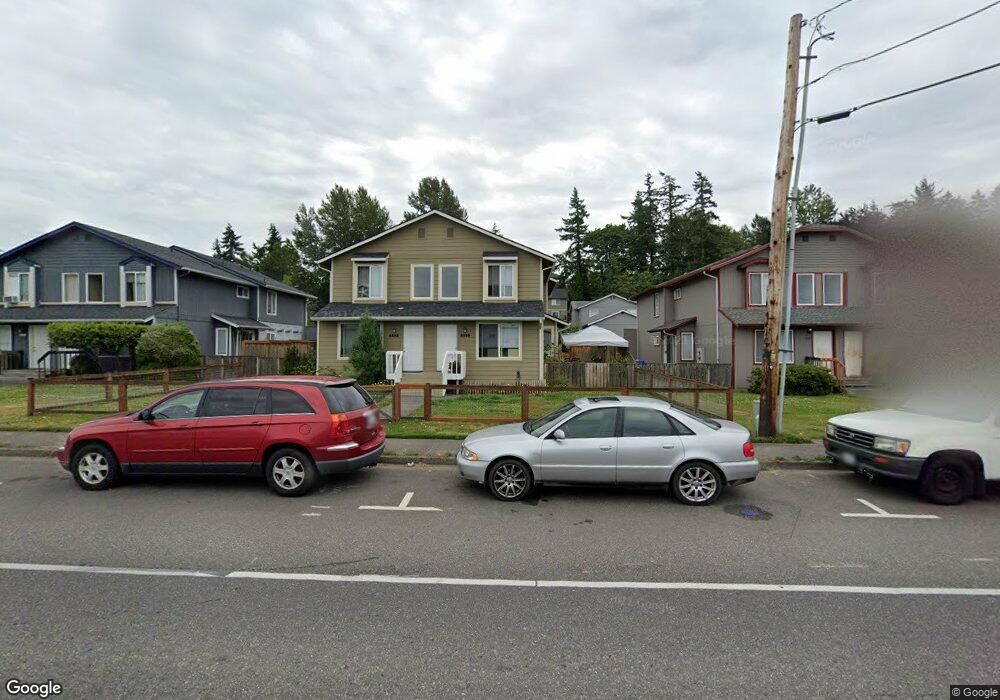
2110 Woburn St Bellingham, WA 98229
Roosevelt NeighborhoodEstimated Value: $742,000 - $787,000
3
Beds
3
Baths
1,902
Sq Ft
$402/Sq Ft
Est. Value
About This Home
This home is located at 2110 Woburn St, Bellingham, WA 98229 and is currently estimated at $764,608, approximately $402 per square foot. 2110 Woburn St is a home located in Whatcom County with nearby schools including Roosevelt Elementary School, Kulshan Middle School, and Bellingham High School.
Ownership History
Date
Name
Owned For
Owner Type
Purchase Details
Closed on
Sep 3, 2014
Sold by
Sand John
Bought by
Tong Michael and Tong Fanny
Current Estimated Value
Purchase Details
Closed on
Dec 29, 2000
Sold by
Stuen Thomas E and Stuen Karen S
Bought by
Sand John
Home Financials for this Owner
Home Financials are based on the most recent Mortgage that was taken out on this home.
Original Mortgage
$134,400
Interest Rate
7.71%
Create a Home Valuation Report for This Property
The Home Valuation Report is an in-depth analysis detailing your home's value as well as a comparison with similar homes in the area
Home Values in the Area
Average Home Value in this Area
Purchase History
| Date | Buyer | Sale Price | Title Company |
|---|---|---|---|
| Tong Michael | $317,500 | Chicago Title Insurance | |
| Sand John | $168,000 | Whatcom Land Title |
Source: Public Records
Mortgage History
| Date | Status | Borrower | Loan Amount |
|---|---|---|---|
| Previous Owner | Sand John | $134,400 |
Source: Public Records
Tax History Compared to Growth
Tax History
| Year | Tax Paid | Tax Assessment Tax Assessment Total Assessment is a certain percentage of the fair market value that is determined by local assessors to be the total taxable value of land and additions on the property. | Land | Improvement |
|---|---|---|---|---|
| 2024 | $5,146 | $644,838 | $226,677 | $418,161 |
| 2023 | $5,146 | $661,216 | $232,434 | $428,782 |
| 2022 | $4,202 | $570,024 | $200,378 | $369,646 |
| 2021 | $4,123 | $452,400 | $159,030 | $293,370 |
| 2020 | $3,814 | $418,889 | $147,250 | $271,639 |
| 2019 | $3,415 | $374,599 | $124,778 | $249,821 |
| 2018 | $3,439 | $336,249 | $112,028 | $224,221 |
| 2017 | $2,967 | $289,500 | $96,450 | $193,050 |
| 2016 | $2,596 | $261,078 | $86,550 | $174,528 |
| 2015 | $2,545 | $237,767 | $79,050 | $158,717 |
| 2014 | -- | $225,585 | $75,000 | $150,585 |
| 2013 | -- | $217,532 | $73,500 | $144,032 |
Source: Public Records
Map
Nearby Homes
- 2138 Woburn St
- 950 Yew St
- 2316 Xenia St
- 2325 Valencia St
- 2330 Verona St
- 2409 Xenia St
- 2602 Woburn St
- 2312 Orleans St
- 2735 Michigan St
- 1735 Sunup Loop
- 1737 Sunup Loop
- 1733 Sunup Loop
- 2209 W Birch St
- 2104 Birch Cir Unit 5C
- 1712 Sunup Loop
- 1714 Sunup Loop
- 1716 Sunup Loop
- 2612 Birch St
- 0 US Highway 27 Hwy N Unit MFRP4936152
- 0 US Highway 27 Hwy N Unit MFRP4935974
- 2110 2112 Woburn
- 2112 Woburn St
- 2114 Woburn St
- 0 2104 2106 2108 Woburn St Unit 5130572-7681158
- 2104 Woburn St
- 2116 Woburn St
- 2121 W Xenia Ln
- 2115 Xenia St Unit 2117
- 2115 Xenia St
- 2111 Xenia Ln
- 2124 Woburn St
- 2109 Xenia St
- 2100 Woburn St
- 2121 Xenia St
- 2123 Xenia St
- 2127 Xenia Ln
- 2103 Xenia Ln
- 2028 Woburn St
- 2134 Woburn St
- 2133 W Xenia Ln