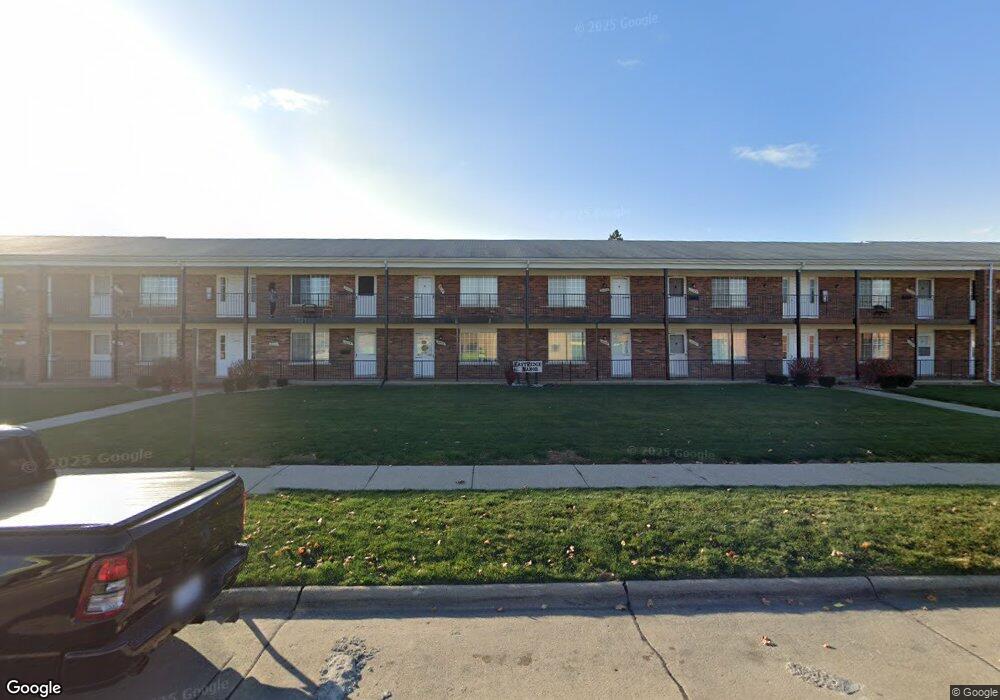
21109 Hayes Ave Unit 3 Eastpointe, MI 48021
Estimated Value: $42,000 - $130,000
1
Bed
1
Bath
659
Sq Ft
$109/Sq Ft
Est. Value
About This Home
This home is located at 21109 Hayes Ave Unit 3, Eastpointe, MI 48021 and is currently estimated at $72,074, approximately $109 per square foot. 21109 Hayes Ave Unit 3 is a home located in Macomb County with nearby schools including Crescentwood Elementary School, Eastpointe Middle School, and Macomb Montessori Academy.
Ownership History
Date
Name
Owned For
Owner Type
Purchase Details
Closed on
May 1, 2025
Sold by
Hails Investments Llc and Hails Jeffery
Bought by
Hails Sandra Bates
Current Estimated Value
Purchase Details
Closed on
Dec 11, 2008
Sold by
Hails Jeffery and Hails Sandra
Bought by
Hails Investments Llc
Purchase Details
Closed on
Sep 16, 2008
Sold by
Hud
Bought by
Hails Jeffery and Hails Sandra
Purchase Details
Closed on
Sep 14, 2007
Sold by
Mortgage Electronic Registration Systems
Bought by
Hud
Purchase Details
Closed on
Mar 2, 2007
Sold by
Stigleman Robert J
Bought by
Mortgage Electronic Registration Systems
Purchase Details
Closed on
Apr 20, 2005
Sold by
Kress Hattie and Gierlowski Adrienne
Bought by
Stigleman Robert J
Home Financials for this Owner
Home Financials are based on the most recent Mortgage that was taken out on this home.
Original Mortgage
$36,069
Interest Rate
6.05%
Mortgage Type
FHA
Create a Home Valuation Report for This Property
The Home Valuation Report is an in-depth analysis detailing your home's value as well as a comparison with similar homes in the area
Home Values in the Area
Average Home Value in this Area
Purchase History
| Date | Buyer | Sale Price | Title Company |
|---|---|---|---|
| Hails Sandra Bates | -- | None Listed On Document | |
| Hails Investments Llc | -- | None Available | |
| Hails Jeffery | $12,000 | None Available | |
| Hud | -- | None Available | |
| Mortgage Electronic Registration Systems | $37,634 | None Available | |
| Stigleman Robert J | $36,900 | Metropolitan Title Company |
Source: Public Records
Mortgage History
| Date | Status | Borrower | Loan Amount |
|---|---|---|---|
| Previous Owner | Stigleman Robert J | $36,069 |
Source: Public Records
Tax History Compared to Growth
Tax History
| Year | Tax Paid | Tax Assessment Tax Assessment Total Assessment is a certain percentage of the fair market value that is determined by local assessors to be the total taxable value of land and additions on the property. | Land | Improvement |
|---|---|---|---|---|
| 2025 | $463 | $23,800 | $0 | $0 |
| 2024 | $408 | $22,700 | $0 | $0 |
| 2023 | $396 | $20,600 | $0 | $0 |
| 2022 | $432 | $14,000 | $0 | $0 |
| 2021 | $426 | $12,400 | $0 | $0 |
| 2020 | $412 | $8,200 | $0 | $0 |
| 2019 | $383 | $8,200 | $0 | $0 |
| 2018 | $416 | $5,760 | $0 | $0 |
| 2017 | $391 | $4,920 | $1,060 | $3,860 |
| 2016 | $390 | $4,920 | $0 | $0 |
| 2015 | $285 | $4,370 | $0 | $0 |
| 2012 | -- | $0 | $0 | $0 |
Source: Public Records
Map
Nearby Homes
- 14872 Collinson Ave
- 14722 Lydia Ave
- 15145 Sprenger Ave
- 15162 Sprenger Ave
- 14661 Lydia Ave
- 14685 Agnes Ave
- 14652 Agnes Ave
- 15298 Veronica Ave
- 15329 Veronica Ave
- 15337 Veronica Ave
- 15400 Sprenger Ave
- 20834 Eastwood Blvd
- 15035 Carlisle St
- 15217 Carlisle St
- 15510 Veronica Ave
- 21166 Dexter Blvd
- 21139 Dexter Blvd
- 21312 Dexter Blvd
- 14978 Carlisle St
- 21503 Eastwood Blvd
- 21141 Hayes Ave Unit 20
- 21137 Hayes Ave Unit 19
- 21129 Hayes Ave
- 21125 Hayes Ave Unit 16
- 21121 Hayes Ave Unit 15
- 21117 Hayes Ave
- 21111 Hayes Ave
- 21107 Hayes Ave Unit 12
- 21139 Hayes Ave Unit 10
- 21135 Hayes Ave Unit 9
- 21131 Hayes Ave
- 21123 Hayes Ave Unit 6
- 21119 Hayes Ave Unit 5
- 21115 Hayes Ave Unit 4
- 21101 Hayes Ave Unit 1
- 21133 Hayes Ave
- 21133 Hayes Ave Unit 18
- 21105 Hayes Ave Unit 2
- 21103 Hayes Ave Unit 11
- 14805 Lydia Ave